Future of the Oxford Cambridge Arc
An interactive article about urban development modelling
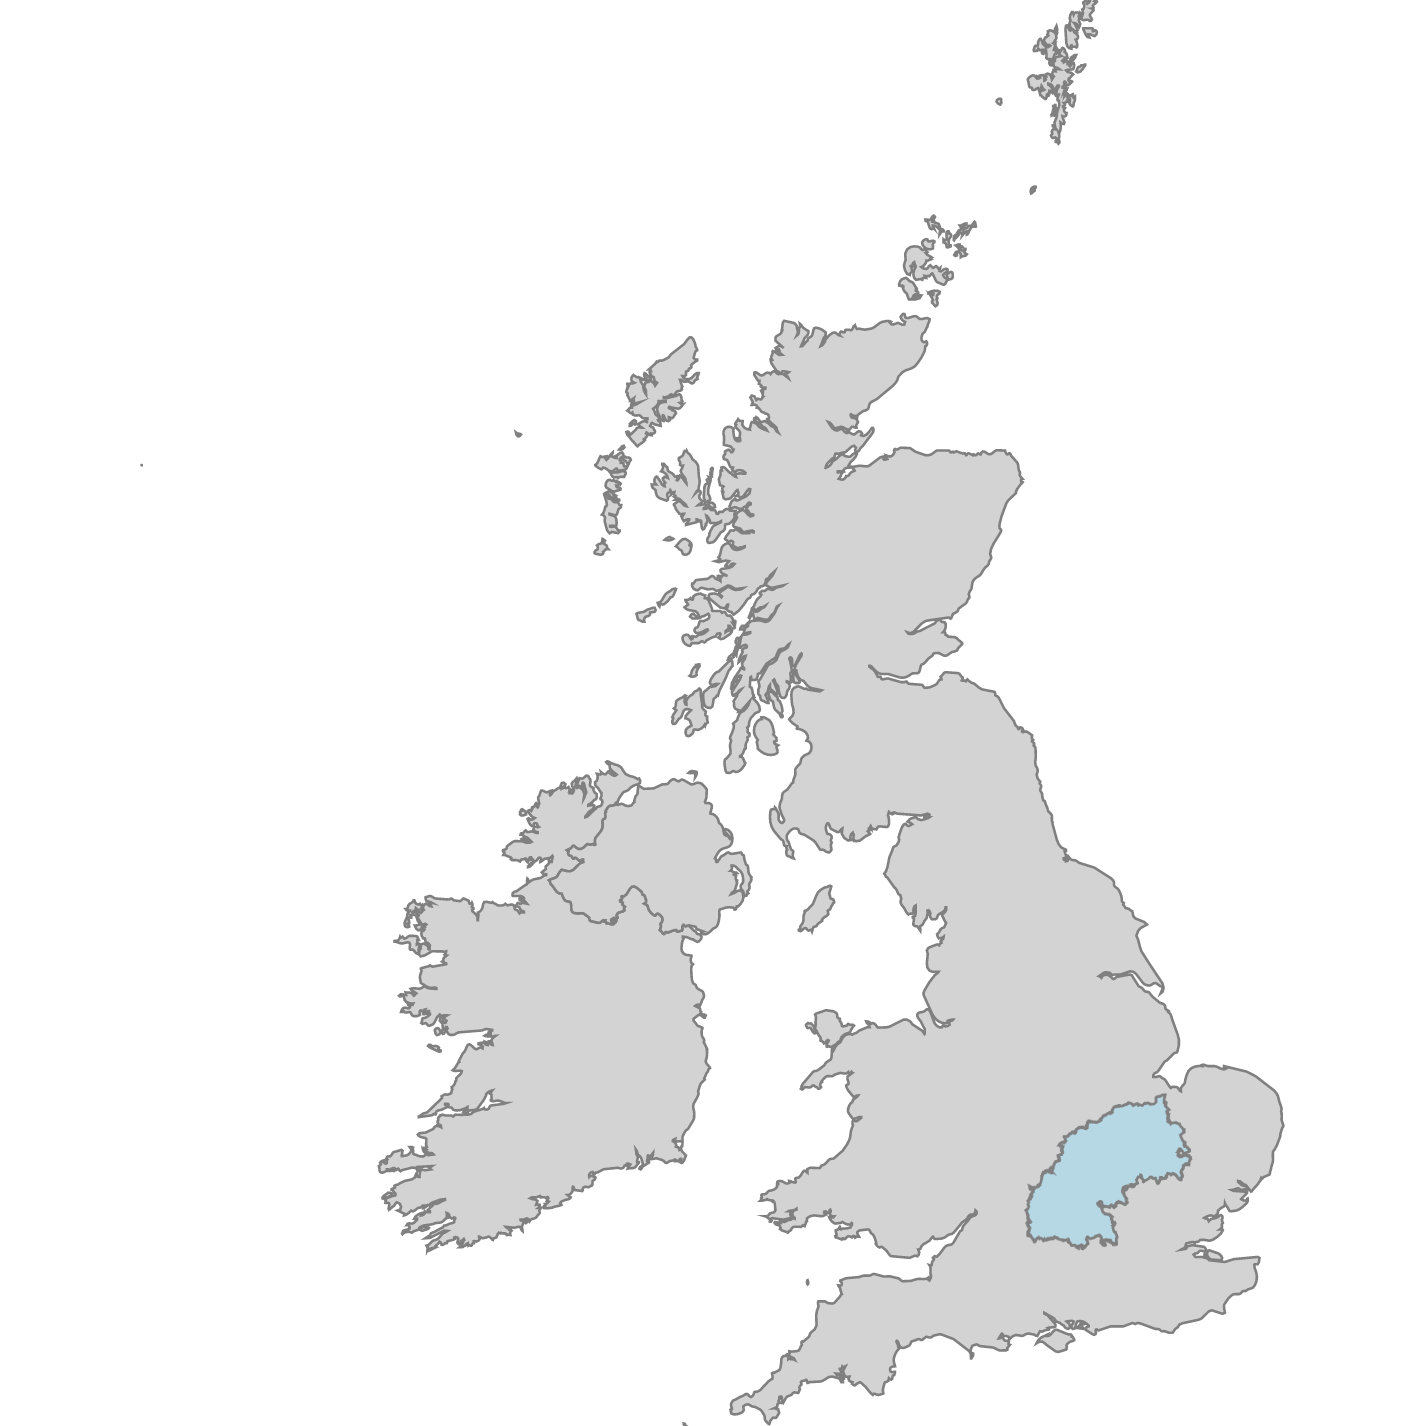
What is the Oxford Cambridge Arc?
The Oxford Cambridge Arc is a region in south central England that runs between Oxford and Cambridge via Milton Keynes, covering Cambridgeshire, Peterborough, Northamptonshire, Bedfordshire, Buckinghamshire and Oxfordshire. It is home to 3.7 million people, generating over 2 million jobs and contributing over £110 billion of annual Gross Value Added (GVA) to the UK economy per year. The area also contains some of the fastest growing and most productive towns and cities in the UK.
Density
Transport
Boundary
Future Development Scenarios
A report published in 2018 by the National Infrastructure Commission outlined substantial plans to increase access and connectivity within the Arc area by 2050. This vision includes one million new homes across the Arc, major improvements to rail routes, and potentially an East-West Expressway road.
Through computer-based simulations, researchers at the University of Oxford and Newcastle University explored possible futures of the Arc in order to learn more about how this vision would impact the built and natural environment.
Two scenarios were identified to guide the broad location of new urban development.
Expansion of existing settlements
- Location of development near existing settlements, with good access to existing employment by road or rail
- Allow some building on green belt land around existing settlements
New Settlements
- Focussed on new centres, around future railway stations
Two additional scenarios were identified to vary the environmental impacts of new development. These affect the attractors and constraints that govern the choice of areas selected for development by the model.
Grey
- Relatively more weight given to proximity to roads and access to employment by road as attractors for development
- Relatively less weight given to avoiding the loss of natural capital
- Core constraints not to build on ancient woodland, flood risk zones, or areas of very high natural capital
Green
- Relatively more weight given to proximity to stations and access to employment by rail as attractors for development
- Relatively more weight given to avoiding the loss of natural capital
- Additional constraints not to build within areas identified as nature recovery networks
Four Future Scenarios
In combination, this gives four extremes to explore:
- Expansion of existing settlements, Grey
- Expansion of existing settlements, Green
- New Settlements, Grey
- New Settlements, Green
The Urban Modelling Process
Based on the assumptions identified for each scenario, a series of urban modelling steps were applied to simulate the outcomes each would have on future development.
Seven Urban Modelling Steps
- Identify elements of the built and natural environment at a 100m grid scale
- Develop scenarios of major factors that will influence the nature of new development
- Calculate attractiveness scores for potential new development locations
- Identify constraints, limiting areas for new development
- Explore target housing densities for different categories of building development
- Allocate future development locations, subject to attractors, constraints and density
- Calculate metrics to evaluate the impact of the new development scenarios
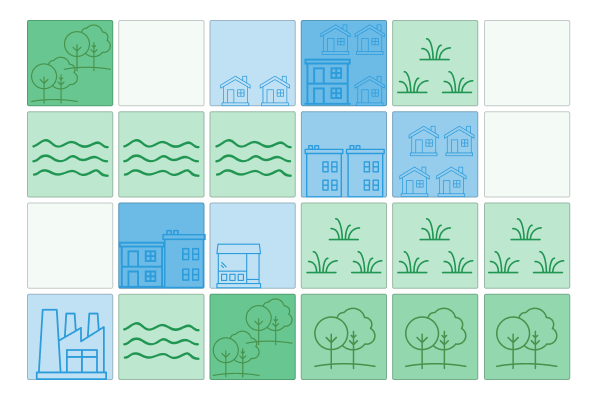
Step 1. Identify elements of the built and natural environment
When applying each step to the Arc scenarios, a series of maps were produced at a 100m grid scale to help visualise the outputs. To highlight the level of detail, each step below will compare images for three scales zooming in from the Arc, to city, and neighbourhood level.
Step 1: Identify elements of the built and natural environment at a 100m grid scale
Change Scale
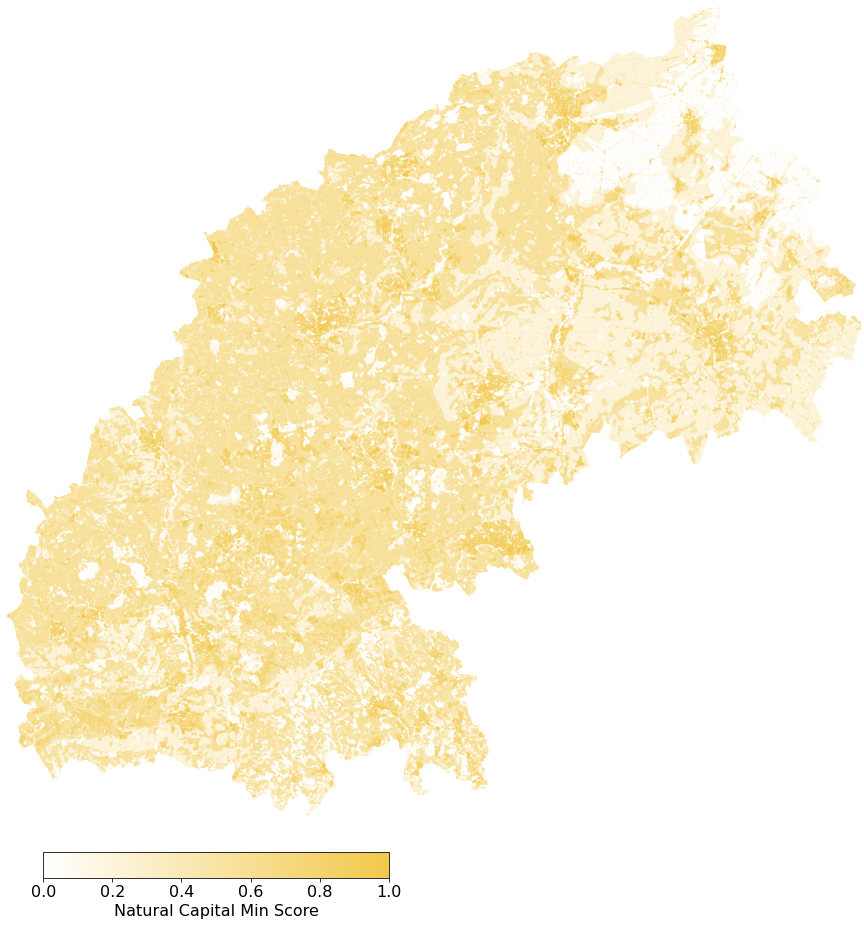
Ecosystem services
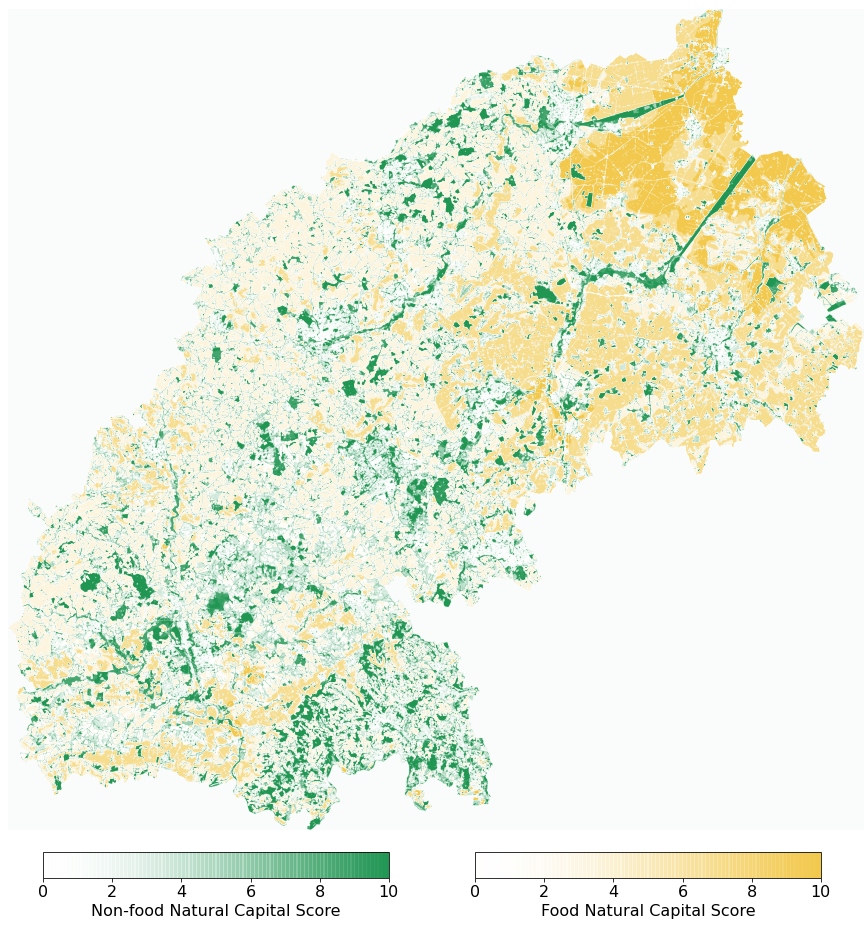
This map shows some of the different ecosystem services that we receive from all sorts of natural and cultivated land and water, including farmland, grasslands, woodlands, water bodies, urban parks, allotments and even roadside verges. For most of the maps, areas that deliver higher levels of the service are shown in darker shades of green. The ‘Maximum values’ map shows the best areas for food production in yellow and the best areas for the other ecosystem services in shades of green.
Step 2: Develop scenarios of major factors that will influence the nature of new development
Future Transport
Major factors affecting the location of future housing development include the locations of new railways, railway stations, roads, and existing settlements. Proposed new transport infrastructure includes new stations and rail links as part of East West Rail (EWR) that will link Oxford and Cambridge. In the New Settlements scenario, five new settlement centres are assumed to be centred on potential new railway station locations.
Step 3. Calculate attractiveness scores for potential new development
Scale
Attractor
The map shows various ways of calculating the level of attractiveness of potential locations for new housing development in the Arc. Attractors are factors that may make somewhere relatively more attractive as a place to build housing, such as proximity (distance) or accessibility to transport hubs and jobs, or lower ecosystem service scores, meaning that fewer ecosystem services may be lost if an area is developed.
Step 4: Identify constraints
Scale
Scenario
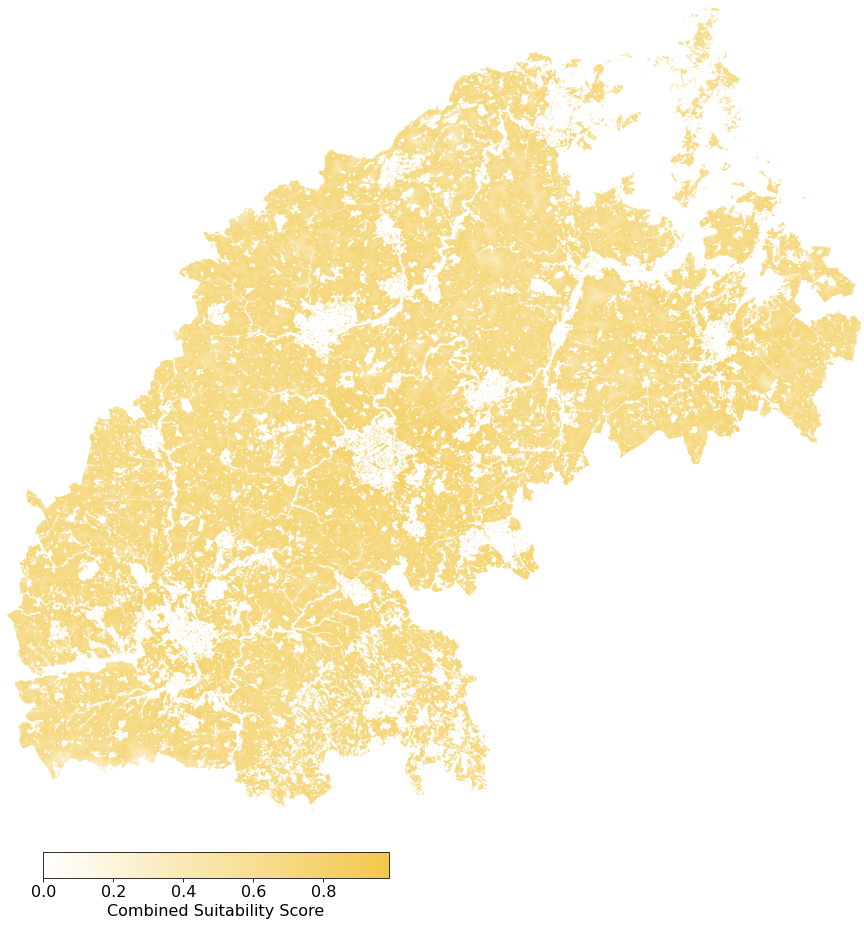
This map shows the combined attractiveness scores for each scenario, and masks out (in white, with attractiveness equal to zero) areas where development should be restricted. These constraints are included to protect nature, wildlife, historical landmarks, and areas which are not feasible to develop.
Step 5. Explore target housing densities for different categories of building development
Scale
Scenario
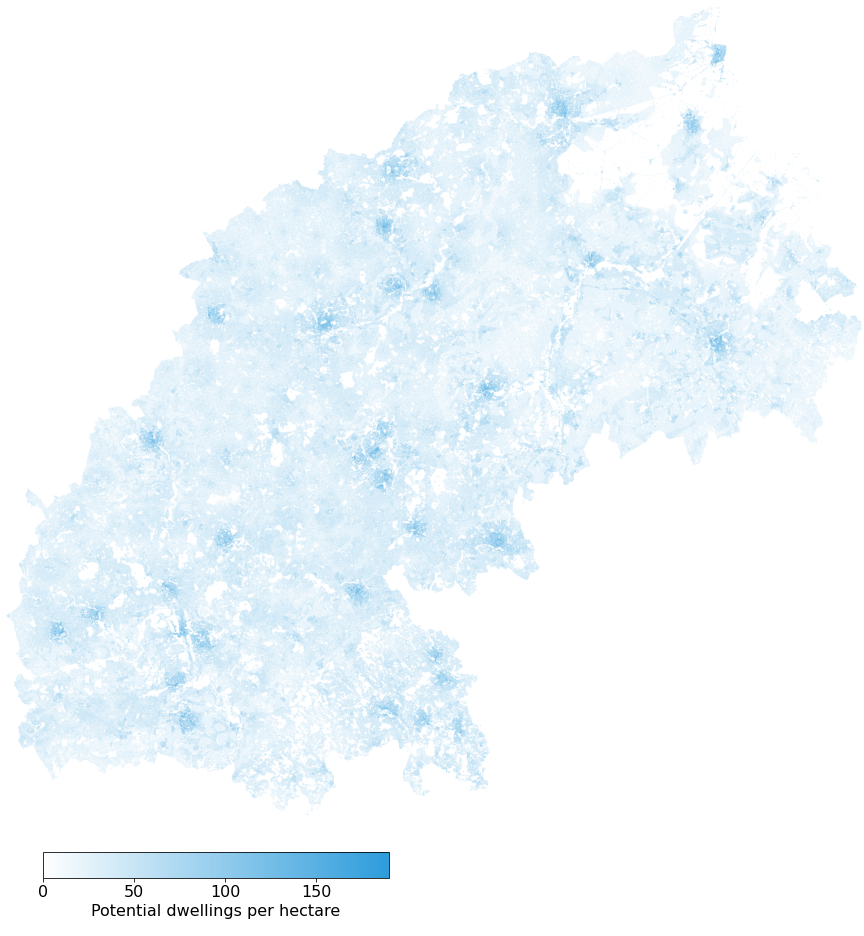
This map shows possible target housing densities for any new developmentacross the Arc. For example, in New Settlements scenarios, there are high density zones around new centres and in Green scenarios there is a minimum housing density for any new development, in order to reduce the amount of land needed for a given number of houses.
Step 6. Allocate future development locations, subject to attractors, constraints and density
Scale
Scenario
Rate
Year
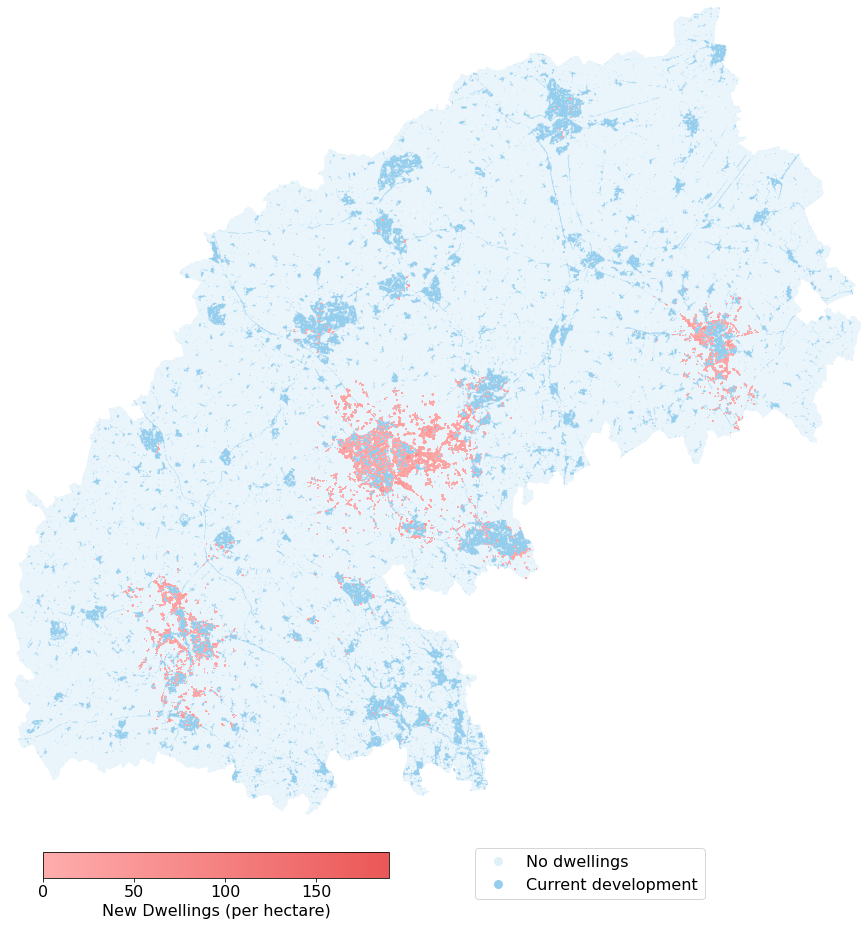
The final map shows the scenarios of future development that will take place in the Arc, given different assumptions about how many houses are built in the region up to 2030 or 2050, following the four scenarios which set up combinations of attractors, constraints and housing density.
Step 7. Calculate metrics to evaluate the new development scenarios
While simulations cannot capture every nuance about the future built environment, analysing and visualising the trade-offs can help planners and policy-makers make informed decisions. The following charts show the summary of results for both the area of land developed and the impact on ecosystem services for each of the four scenarios explored.
Land taken for development
The bar chart shows the area of land taken for development in each scenario.
Summary of land taken for development
- When comparing Expansion vs. New Settlements, there is not a major difference in total land take - though the location of development is very different. In the Expansion scenario, developments sprawl around existing urban areas, whereas in New Settlements there are new high density centres, so a little less land is taken overall.
- When comparing Grey vs. Green, the Green scenario takes less land because it assumes a higher housing density for all new development.
Ecosystem service impact
The grouped bar chart shows the potential impacts on ecosystem services, given the locations identified for development and the ecosystem services currently provided by those places.
Summary of impact on ecosystem services
- Water supply services are significantly affected across all scenarios, because of the construction of a large area of sealed surfaces. This impact could be reduced by building sustainable drainage systems into new developments, for example capturing rainwater in ponds and rain gardens.
- For water supply and food production, there is a higher impact in the New Settlements scenarios, because the new settlement centres are in higher quality farmland areas with few woodlands.
- Recreation is more affected in the Expansion scenarios, because of the potential loss of recreational spaces around the outskirts of existing towns.
- The Green scenarios have less impact on ecosystem services overall, because of the additional constraints and higher density. They avoid development that will damage our most valuable assets such as native woodlands, high quality farmland and the proposed nature recovery networks. The higher housing density reduces the total area lost to development.
Acknowledgements
This work has been carried out by researchers at the University of Oxford and Newcastle University in the UK, funded by the Alan Turing Institute (ATI), to inform the analysis, planning and design of resilient national, regional and local infrastructure around the world.
The Urban Development Model (UDM) was used to produce the results presented here. The Natural Capital Mapping toolkit was used to assess ecosystem services.
- Heidi Mok, Visualisation design and development
- Tom Russell, Maps and visualisation, scenario development
- James Virgo, Urban development modelling
- Alison Smith, Ecosystem services assessment
- Jim Hall, Discussion, feedback and scenario development
- Alistair Ford, Discussion, feedback and scenario development