# Spatial Data Tools ## Desktop GIS QGIS for viewing spatial data ## Spatial data formats ogr2ogr for converting between formats ## Spatial databases Postgres and PostGIS for storing and querying against a database ## Spatial data libraries GDAL for handling spatial objects in code ## Case study Converting statistics between geographies --- # Install ## OSGeo4W This a bundle installer for Windows that includes QGIS, GDAL and other tools. [https://trac.osgeo.org/osgeo4w/](https://trac.osgeo.org/osgeo4w/) ## QGIS [http://www.qgis.org/](http://www.qgis.org/) ## Postgres [https://www.postgresql.org/](https://www.postgresql.org/) ## PostGIS [http://postgis.net/](http://postgis.net/) --- # Desktop GIS ## QGIS Docs: [http://www.qgis.org/en/docs/index.html](http://www.qgis.org/en/docs/index.html) Tutorial: [http://docs.qgis.org/2.14/en/docs/training_manual/index.html](http://docs.qgis.org/2.14/en/docs/training_manual/index.html) ## ArcGIS If you have access to ArcGIS, then [ArcMap](http://desktop.arcgis.com/en/arcmap/) or [ArcGIS Pro](http://pro.arcgis.com/en/pro-app/) have similar feature sets. --- # QGIS: view data - new project - folder structure (importance of relative references) - import shapefile - zoom to layer - view attribute table - identify node - layer properties - style - labels --- # QGIS: open project QGIS organises work into projects, projects have layers of data.  --- # Download data **Edina** provide boundary data for the UK. [InFuse United Kingdom Output Areas, 2011](https://census.edina.ac.uk/easy_download_data.html?data=infuse_uk_2011) [English Districts, UAs and London Boroughs, 2011, Clipped](https://census.edina.ac.uk/easy_download_data.html?data=England_lad_2011) <small> Contains National Statistics data © Crown copyright and database right 2016<br> Contains NRS data © Crown copyright and database right 2016<br> Source: NISRA : Website: www.nisra.gov.uk<br> Contains OS data © Crown copyright [and database right] (2016) </small> **ONS** provide census statistics. [Key and Quick Statistics for Output Areas in the UK](http://data.statistics.gov.uk/Census/KS_QS_OA_UK_V1.zip) <small> Source: Office for National Statistics, Northern Ireland Statistics and Research Agency,<br> National Records of Scotland © Crown Copyright 2014 </small> --- # QGIS: add layer Use the menu `Layer > Add Layer > Add Vector Layer` or the icon in the sidebar to add a vector layer (here a shapefile).  --- # QGIS: add layer The layer appears in the layers panel. The order here corresponds to the drawing order, so higher layers will cover lower layers.  --- # QGIS: view attribute table Right click on the layer in the layers panel, or use the icon to open the attributes table.  --- # QGIS: identify an object Use the identify tool to query an object's attributes.  --- # QGIS: add labels to a layer Right click on a layer to edit its properties, go to labels and select the attribute to use as a label.  --- # QGIS: change displayed projection Coordinate reference system (CRS) is a project-wide property, and can be changed so that each layer is re-projected on the fly.  --- # QGIS: change displayed projection For the UK, the Ordnance Survey/British National Grid reference system (also encoded as OSGB36 or EPSG:27700) minimises distortion.  --- # QGIS: add a csv Use the menu `Layer > Add Layer > Add Delimited Text Layer` or the icon in the sidebar to add a csv. Check the field properties to see that the data types are correct. 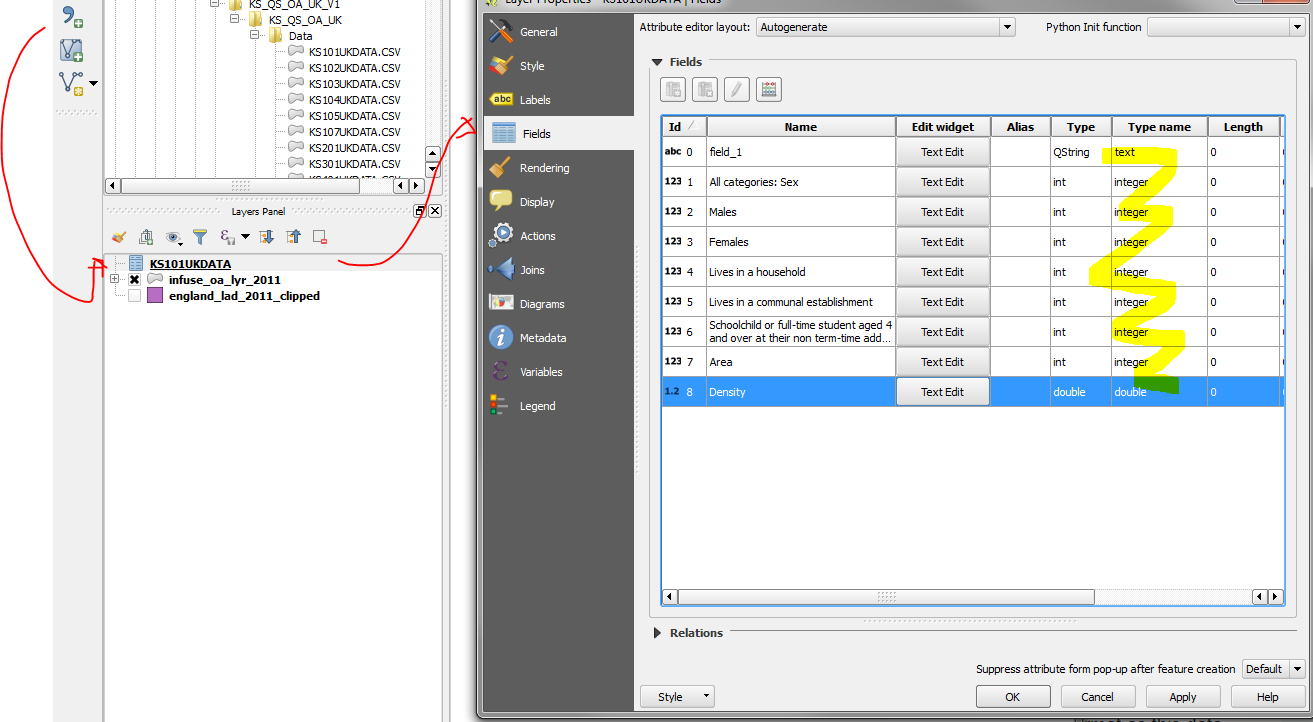 ??? CSVs don't natively contain type information, so QGIS will make an informed guess. You might need to clean your csv data to help (remove thousands separators, delete any non-data rows other than a single header row). It is also possible to create a `*.csvt` file, which specifies the data type of each column of the `*.csv` file of the same name. --- # QGIS: join a table to a vector layer In layer properties, go to joins and add a join, selecting the layer to pull from and the "join" and "target" fields from each layer that share a value (usually some ID). 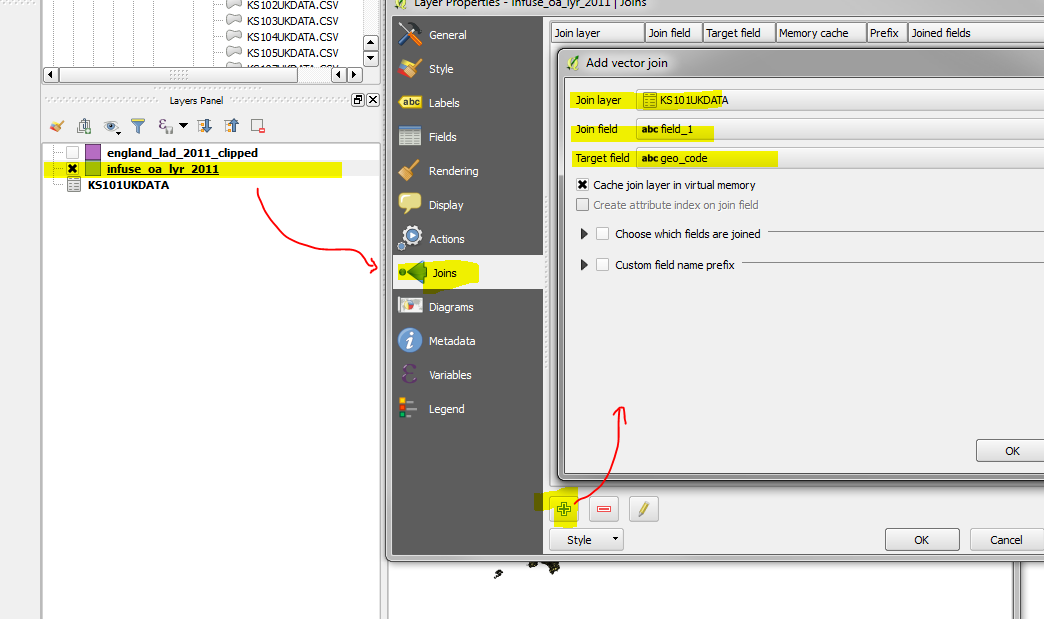 --- # QGIS: join a table to a vector layer Check the results in the layer's attribute table. The columns from the csv should have appeared. 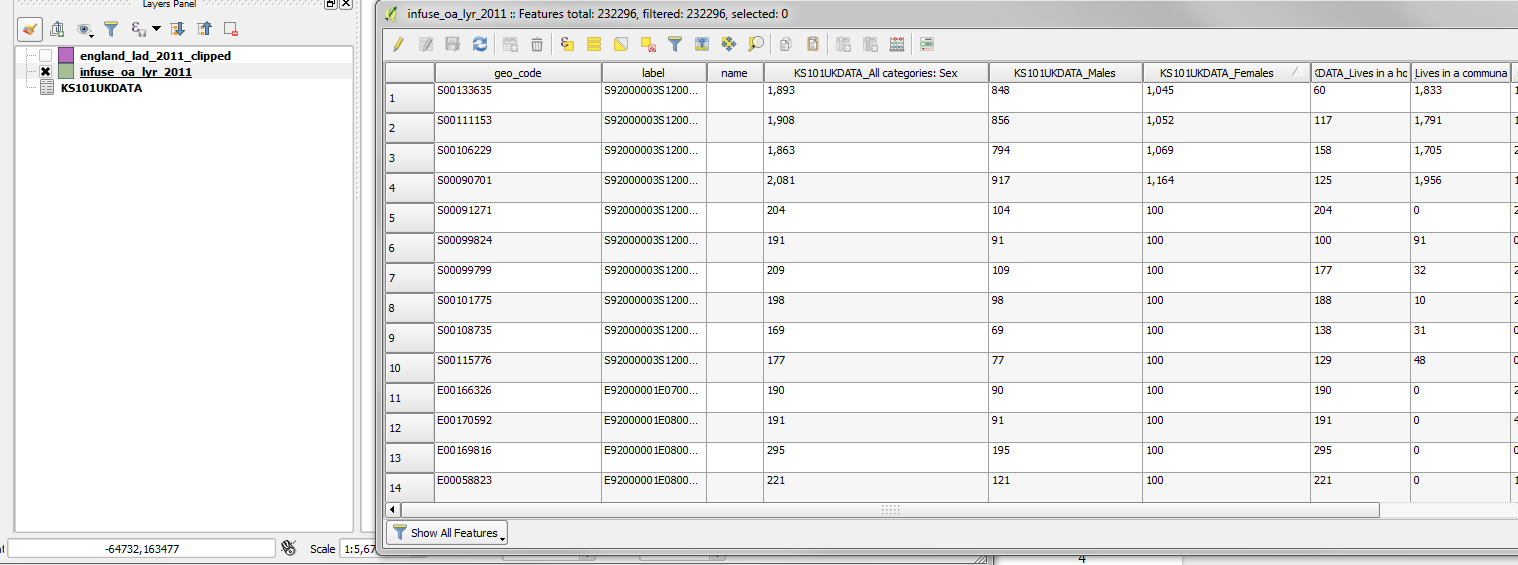 --- # QGIS: edit layer style Plotting total population counts for each output area. Right click on a layer to see its properties and edit the style. Pick 'graduated' to represent a scalar value, pick the column to show and a colour ramp to use, then classify and apply. 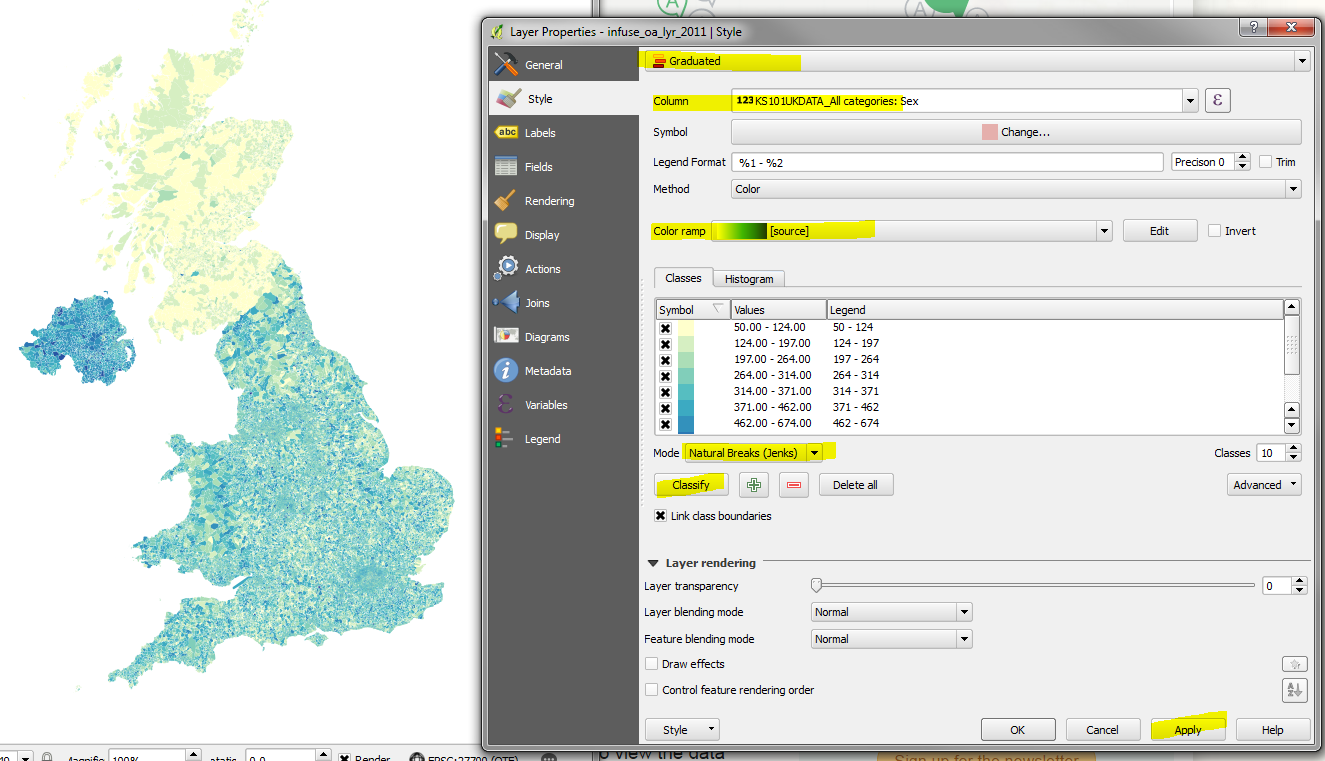 ??? There are several ways of generating colour classes, including custom breaks, equal interval or quantile. Jenks natural breaks is an optimisation method which minimises the variance within classes while maximizing the variance between classes. --- # QGIS: edit layer style Plotting population density, rather than absolute counts. Select the column, reclassify and apply to see the results.  --- # Questions Preview data in desktop GIS - add layers - view tables - join data - edit style Next: data formats --- # Data formats Vector: [http://www.gdal.org/ogr_formats.html](http://www.gdal.org/ogr_formats.html) - shapefile - csv - geojson - kml - osm.xml, osm.pbf - WKT, WKB - sql Raster: http://www.gdal.org/formats_list.html - ascii grid - tiff - png, mbtiles --- # Shapefile Spec: [https://www.esri.com/library/whitepapers/pdfs/shapefile.pdf](https://www.esri.com/library/whitepapers/pdfs/shapefile.pdf) Essential files - `*.shp` main file, contains geometric data - `*.shx` index file, contains offsets and content length for records in the main file - `*.dbf` dBASE table, contains the attribute table Other files - `*.sbn`, `*.sbx` spatial index - `*.prj` projection details - `*.shp.xml` spatial metadata - `*.cpg` dBASE metadata (text encoding codepage, eg `UTF8`) --- # Delimited text CSV ```csv X,Y,osm_id,timestamp,name,type 34.4613073,31.506574,504259355,2014-08-09T17:22:21Z,Arab Bank,bank 34.4443115,31.5201754,504263800,2012-12-18T13:47:22Z,Quds Bank,bank 34.4552552,31.5164901,4210637190,2016-05-27T12:06:42Z,بنك القدس فرع غزة,bank ``` Tab-delimited ```txt lon lat osm_id timestamp name type 34.3197512 31.3034058 329170797 2009-02-17T06:55:01Z European Gaza Hospital - مستشفى غزة ا hospital 34.4937895 31.5406455 503999419 2009-09-21T12:32:03Z Palestinian Medical Relief hospital ``` --- # GeoJSON Spec: [https://tools.ietf.org/html/rfc7946](https://tools.ietf.org/html/rfc7946) Guide: [http://geojson.org/](http://geojson.org/) ```json { "type": "Feature", "geometry": { "type": "Point", "coordinates": [125.6, 10.1] }, "properties": { "name": "Dinagat Islands" } } ``` --- # KML Spec: [http://www.opengeospatial.org/standards/kml/](http://www.opengeospatial.org/standards/kml/) Guide: [https://developers.google.com/kml/](https://developers.google.com/kml/) ```xml <?xml version="1.0" encoding="UTF-8"?> <kml xmlns="http://www.opengis.net/kml/2.2"> <Placemark> <name>Simple placemark</name> <description>Attached to the ground. Intelligently places itself at the height of the underlying terrain.</description> <Point> <coordinates>-122.0822035425683,37.42228990140251,0</coordinates> </Point> </Placemark> </kml> ``` --- # OpenStreetMap XML Notes: [http://wiki.openstreetmap.org/wiki/OSM_XML](http://wiki.openstreetmap.org/wiki/OSM_XML) ```xml <?xml version="1.0" encoding="UTF-8"?> <osm version="0.6" generator="CGImap 0.0.2"> <bounds minlat="54.0889580" minlon="12.2487570" maxlat="54.0913900" maxlon="12.2524800"/> <node id="298884269" lat="54.0901746" lon="12.2482632" user="SvenHRO" uid="46882" visible="true" version="1" changeset="676636" timestamp="2008-09-21T21:37:45Z"/> <node id="1831881213" version="1" changeset="12370172" lat="54.0900666" lon="12.2539381" user="lafkor" uid="75625" visible="true" timestamp="2012-07-20T09:43:19Z"> <tag k="name" v="Neu Broderstorf"/> <tag k="traffic_sign" v="city_limit"/> </node> <way id="26659127" user="Masch" uid="55988" visible="true" version="5" changeset="4142606" timestamp="2010-03-16T11:47:08Z"> <nd ref="292403538"/> <nd ref="298884289"/> <tag k="highway" v="unclassified"/> <tag k="name" v="Pastower Straße"/> </way> <relation id="56688" user="kmvar" uid="56190" visible="true" version="28" changeset="6947637" timestamp="2011-01-12T14:23:49Z"> <member type="node" ref="294942404" role=""/> <member type="way" ref="4579143" role=""/> <tag k="name" v="Küstenbus Linie 123"/> <tag k="type" v="route"/> </relation> </osm> ``` --- # OpenStreetMap PBF PBF (Protocol Buffers) are a binary serialization format. Guide: [https://developers.google.com/protocol-buffers/](https://developers.google.com/protocol-buffers/) OpenStreetMap define a particular set of protocols against pbf. OSM PBF usage: [http://wiki.openstreetmap.org/wiki/PBF_Format](http://wiki.openstreetmap.org/wiki/PBF_Format) --- # WKT, WKB - Well-Known Text/Binary ```txt POINT (34.4613073 31.506574) ``` ```txt 0101000020E6100000AA6D799BED284140AE6AA400AC4D3F40 ``` ```txt POLYGON ((34.4613073 31.5067543780869,34.4613438592451 31.5067516377333,34.46137 93076498 31.5067434999371,34.4614125681267 31.5067302119626,34.4614426300691 31. 5067121775601,34.4614685800579 31.5066899446983,34.4614896296158 31.506664188914 2,34.4615051391647 31.5066356927868,34.461514637459 31.5066053221585,34.46151783 59033 31.5065739998268,34.4615146373208 31.5065426775054,34.4615051389048 31.506 5123069068,34.4614896292656 31.5064838108247,34.4612707407549 31.5067516377333,3 4.4613073 31.5067543780869)) ``` --- # SQL ```sql INSERT INTO "public"."gaza_hospitals" ( "wkb_geometry" , "osm_id", "timestamp", "name", "type" ) VALUES ( '0101000020E6100000AA6D799BED284140AE6AA400AC4D3F40', '329170797', '2009-02-17T06:55:01Z', 'European Gaza Hospital - مستشفى غزة ا', 'hospital' ); ``` --- # ascii grid ```txt ncols 200 nrows 200 xllcorner 210000 yllcorner 700000 cellsize 50 105.7 105.1 110.3 101.1 102.7 108.2 112.5 109 100.4 73.2 46.8 28.1 10.6 -1.4 -1.4 -1.4 -1.4 -1.4 -1.4 -1.4 -1.4 -1.4 -1.4 -1.4 -1.4 -1.4 -1.4 0.2 6.9 21.7 35.7 54.7 70.8 81.3 98.1 124.5 142.4 160.1 177.6 195.4 223.5 246.3 265.1 280.7 288.7 290.8 293.1 296.8 301.2 304.5 311 315.5 314.9 316.2 315.1 310.6 303.2 291.5 278.5 257.8 238.8 227 219.8 208.2 197.1 189.4 181.7 177.5 162.1 149 136.1 119.1 109.7 115.9 113.8 112.8 108.5 100.6 92.8 88.2 84.6 79.3 75.4 71.7 71.8 70.2 70.7 73.8 71.6 70.2 65.6 55.5 45.1 41.3 34 26.8 19.7 12.3 3.8 -1.4 -1.4 -1.4 -1.4 -1.4 -1.4 -1.4 -1.4 -1.4 -1.4 -1.4 -1.4 -1.4 -1.4 -1.4 -1.4 -1.4 -1.4 -1.4 -1.4 -1.4 -1.4 -1.4 -1.4 -1.4 -1.4 -1.4 -1.4 -1.4 -1.4 -0.3 -1.4 -1.4 -0.9 0 0.3 1.1 5.7 11.1 16.7 23.3 30.9 39.7 41 37.6 34.9 32.9 33.6 33.8 33 32.7 40.6 41 39.8 44.2 48.2 53.2 56.1 57.3 57.5 54.8 47.8 42 34 30.9 29 31 34.3 42.9 47.7 46.7 50.1 54.1 57.2 61.5 63.5 66 69.3 72.9 79.2 84.4 88 95.6 96.2 98 99.3 104.6 109.8 112.4 123 128.3 129.4 135.2 140.9 146.3 153.6 164.5 172.2 180 187.3 193.5 79 85.6 85.6 82.6 91.8 100.4 106.6 102.7 76.6 49.1 31.9 18.6 3.9 -1.4 -1.4 -1.4 -1.4 -1.4 -1.4 -1.4 -1.4 -1.4 -1.4 -1.4 -1.4 -1.4 -1.4 3.4 8.7 23.8 37.2 57.3 75.2 94.3 107.4 130.7 151.6 167.3 181 197.4 219.8 248.4 266.3 277.9 278.2 278.8 281.2 283.8 286.9 293.2 298.1 299.9 297 293.8 291.9 286.3 274.6 263.3 245.6 226 212 201.8 192.6 181.6 175.4 164.7 156.6 145.7 138.8 129.5 118.3 105.5 94.1 98.6 97.9 91.8 87.6 79.3 75 71.6 69.1 65.7 61.9 62.7 60.7 63.6 65.1 62.6 59.3 55.8 49.2 38.4 31.4 28 21.9 11.3 5.5 2 -1.4 -1.4 -1.4 -1.4 -1.4 -1.4 -1.4 -1.4 -1.4 -1.4 -1.4 -1.4 -1.4 -1.4 -1.4 -1.4 -1.4 -1.4 -1.4 -1.4 -1.4 -1.4 -1.4 -1.4 -1.4 -1.4 -1.4 -1.4 -1.4 -1.4 -1.4 3.4 4.9 4.9 3.8 2.9 3.5 5.6 11.9 18.7 24.6 30.1 38.7 42 40.8 40.1 37.9 37.1 37.9 38.7 40.5 37.7 39.7 44.8 43.3 48 52.3 56.2 59.2 61.3 62.2 62.2 61.7 58.4 54.4 47 44.3 38.6 32 38 38.3 39.1 39.9 40.5 44 47.3 52.6 51.3 55.3 60.9 63.3 64.9 67.2 70.5 73.9 78.2 79.1 83.2 88.5 92.7 98.4 104.3 107.3 111.4 118.9 124.4 132.6 140.5 149.6 153.9 165.4 170.3 ```  from [OS Terrain 50](https://www.ordnancesurvey.co.uk/business-and-government/products/terrain-50.html) <small>(Contains OS data © Crown copyright and database right 2016.)</small> --- # NetCDF Docs: https://www.unidata.ucar.edu/software/netcdf/docs_rc/ - for array-oriented scientific data - commonly used for environmental datasets  <small>from [NASA Scientific Visualization Studio / Goddard Space Flight Center, via Wikipedia](https://commons.wikimedia.org/wiki/File:16-008-NASA-2015RecordWarmGlobalYearSince1880-20160120.png)</small> --- # TIFF Spec: http://partners.adobe.com/public/developer/tiff/index.html - originally for scanned images - can be bilevel, grayscale, paletted or full colour ## GeoTIFF Docs: https://trac.osgeo.org/geotiff/ - metadata can be embedded in the file - or a `*.tfw` "world file" ([wiki](https://en.wikipedia.org/wiki/World_file)) can be saved alongside, which describes the location, scale and rotation of the transform to apply to the image to get geographical coordinates. --- # Questions Data formats - vector formats - raster formats Next: converting data --- # ogr2ogr Docs: http://www.gdal.org/ogr2ogr.html **convert** between formats (shp/osm/geojson/csv/sql...) `ogr2ogr -f GeoJSON cities.json cities.shp` **transform** between coordinate systems (WGS84/OSGB36/Web mercator...) `ogr2ogr -t_srs EPSG:27700 cities_osgb.shp cities.shp` **clip** regions `ogr2ogr -f "ESRI Shapefile" output.shp input.shp -clipsrc <xmin> <ymin> <xmax> <ymax>` **simplify** geometries `ogr2ogr output.shp input.shp -simplify 0.0001` **filter** on fields `ogr2ogr -where "type = pond" ponds.shp water.shp` --- # Other GDAL utilities Docs: http://gdal.org/gdal_utilities.html - `gdalinfo` - report information about a file - `gdalwarp` - warp an image into a new coordinate system - `gdalbuildvrt` - build a VRT (virtual dataset) from a list of datasets - `gdal_contour` - contours from DEM (digital elevation map) --- # Questions Converting data - between formats - between coordinate systems - filtering and clipping - other tools Next: spatial databases --- # PostGIS Docs: [http://postgis.net/docs/manual-2.3/](http://postgis.net/docs/manual-2.3/) Tutorial: [http://workshops.boundlessgeo.com/postgis-intro/index.html](http://workshops.boundlessgeo.com/postgis-intro/index.html) PostGIS is an extension to Postgres. It needs to be enabled once per database. ```bash createdb spatial_data_workshop # create new database psql -d spatial_data_workshop # log in to database using command line client CREATE EXTENSION postgis; # create postgis extension ``` -- Store spatial data alongside standard data types ```sql CREATE TABLE workshop_nodes ( node_id serial PRIMARY KEY -- Primary key and id field , node_name text -- Name of node asset , condition integer -- Rating of node condition (good, average, poor) , last_updated timestamp with time zone DEFAULT now() , properties jsonb -- Key-value map of additional node-specific attributes , location geography(POINT, 4326) -- Node geometry (GIS location, shape) ); ``` --- # More PostGIS Create geographical index ```sql CREATE INDEX workshop_nodes_gist ON workshop_nodes USING GIST ( location ); ``` -- Add custom data type to provide a category-type field ```sql CREATE TYPE data_status AS ENUM ('staged', 'approved', 'archived'); ALTER TABLE workshop_nodes ADD COLUMN status data_status DEFAULT 'staged' ``` --- # Load data to Postgres using ogr2ogr Import to a new table: ```sql ogr2ogr -f "PostgreSQL" PG:"dbname=test user=test password=test" \ <shapefile_to_import>.shp ``` Append to an existing table: ```bash ogr2ogr -update -append -f "PostgreSQL" PG:"dbname=test user=test password=test" \ Gaza_electricity_sinks.shp -nln sos_i_nodes \ -sql "SELECT Name as node_name, 'electricity_sink' as type, ID as ref_key, 'gaza' as area, 2 as data_source_id FROM Gaza_electricity_sinks" ``` `-nln` specifies the table name `-sql` lets you select which shapefile attributes to import. It also allows matching attributes to column names (`ID as ref_key`) and setting the value for specific columns (`2 as data_source_id`) --- # Query by location Within a 300m radius of a point (here the point is constructed from WellKnownText, and the fact that we're using lat/lng values is specified by the SRID [4326](http://epsg.io/4326)) ```sql SELECT * FROM events WHERE ST_DWithin( events.the_geom, ST_GeomFromText('POINT(51.2 1.3)', 4326), 300 )); ``` Anything intersecting a bounding box: (fill in values for x/y min/max and your SRID) ```sql SELECT * FROM sos_i_nodes WHERE events.the_geom && ST_MakeEnvelope(xmin, ymin, xmax, ymax, srid); ``` --- # Query spatial measurements Docs: [http://postgis.net/docs/reference.html#Spatial_Relationships_Measurements](http://postgis.net/docs/reference.html#Spatial_Relationships_Measurements) ```sql SELECT road_id, ST_Length(the_geom) FROM all_roads; ``` ```sql ALTER TABLE output_areas ADD COLUMN area real; UPDATE output_areas SET area = SELECT ST_Area(the_geom); ``` --- # Questions Spatial databases - create a database - load data - query data - spatial analysis Next: libraries --- # GDAL Comes installed with OSGeo4W or QGIS. - Windows binaries are maintained at: [http://www.gisinternals.com/](http://www.gisinternals.com/) (or [build](https://trac.osgeo.org/gdal/wiki/BuildingOnWindows)) - Mac binaries are available at: [http://www.kyngchaos.com/software/frameworks#gdal_complete](http://www.kyngchaos.com/software/frameworks#gdal_complete) or `brew install gdal` - Ubuntu has a default package: `sudo apt-get install gdal-bin` C++/C library with [bindings](https://trac.osgeo.org/gdal/wiki#GDALOGRInOtherLanguages) for other languages. - fiona for Python [https://github.com/Toblerity/Fiona](https://github.com/Toblerity/Fiona) - pygdal [https://pypi.python.org/pypi/pygdal/1.10.1.0](https://pypi.python.org/pypi/pygdal/1.10.1.0) - Java [https://trac.osgeo.org/gdal/wiki/GdalOgrInJava](https://trac.osgeo.org/gdal/wiki/GdalOgrInJava) - C# [https://trac.osgeo.org/gdal/wiki/GdalOgrInCsharp](https://trac.osgeo.org/gdal/wiki/GdalOgrInCsharp) - R [https://cran.r-project.org/web/packages/rgdal/index.html](https://cran.r-project.org/web/packages/rgdal/index.html) --- # GDAL capabilities Do any ogr2ogr operation programmatically - read or write to spatial data formats - create points, lines, polygons - filter geometries by attribute - reproject data --- # GEOS Docs: [https://trac.osgeo.org/geos](https://trac.osgeo.org/geos) C++ port of the Java Topology Suite [JTS](http://tsusiatsoftware.net/jts/main.html); used by PostGIS for many spatial functions. Libraries: - Shapely for Python [https://pypi.python.org/pypi/Shapely/](https://pypi.python.org/pypi/Shapely/) - GeoTools for Java [http://www.geotools.org/](http://www.geotools.org/) --- # GEOS capabilities Do any common spatial operation programmatically - create points, lines, polygons - evaluate spatial predicates: intersects, touches, within, contains, overlaps, covers - perform operations: union, distance, intersection, convex hull, envelope, buffer, simplify, area, length --- # Questions Libraries - reading and writing spatial data formats - spatial analysis, logical operations Next: case study --- # Case study - pick small area - import output areas with population - import Local Authority districts as reporting area - import grid as reporting area - assume uniform / divide area to calculate pop per reporting area Work in progress: https://github.com/tomalrussell/aggregation-case-study (used to produce the following) --- # Output areas  --- # Local Authority Districts  --- # Grid cells  --- # Questions - how to unpack the necessary functions for interpolating or assigning probability mass to areas - assigning points to a network? - assigning areas of influence to a set of points? - other spatial problems?