Tools, tips and tricks (A-Z)
This is a grab-bag collection of examples and tools, notes, hints and pointers to good practices.
All the data conversions
ogr2ogr is a spatial data format swiss army knife
Re-project a shapefile:
ogr2ogr \
    -s_srs "EPSG:4326" \            # source srs
    -t_srs  "EPSG:27700" \          # target srs
    buildings_osgb.shp              # output filename
    buildings_latlon.shp            # input filename
Convert from GeoDatabase to CSV, filtering and selecting:
ogr2ogr \
    -f CSV \                        # output a CSV
    -limit 10 \                     # only 10 features
    -select FloorArea,AvgPop2016 \  # only 2 attributes
    ./nrd_res.csv \                 # output filename
    ./nrd.gdb \                     # filename to read from (this one's a geodatabase)
    -lco GEOMETRY=AS_WKT \          # output geometry as Well-Known-Text in the CSV
NRD2014_LTIS_FloorArea_RES          # input layer name to read
The docs are quite terse, but there are helpful blog posts and cheatsheets around.
Commit messages
Good commit messages are helpful for future collaborators (including your future self).
- taken from a blog post by Chris Beams
Rules:
- Capitalize the subject line
- Use the imperative mood in the subject line
One-line commit messages can be great - clear and succinct:
Fix typo in introduction to user guide
Sometimes more context is very useful:
- Separate subject from body with a blank line
- Use the body to explain what and why vs. how
Summarize changes in around 50 characters or less

Explain the problem that this commit is solving. Focus on why you
are making this change as opposed to how (the code explains that).

Further paragraphs come after blank lines.

 - Bullet points can be handy, too
 - Use a hyphen or an asterisk

If you use an issue tracker, put references to them at the bottom,
like this:

Resolves: #123
See also: #456, #789
Databases
If you know shapely, you almost know PostGIS:
The Postgres docs are very good:
Start with a the PostgreSQL tutorial for a database intro/refresher:
Work through ‘Intro to PostGIS’ with examples and exercises:
Excel
Pivot table/chart
Reading - just use pandas
Updating, calculating - xlwings interacts with Excel, strong alternative to VBA scripting!
GIFs
Making GIFs from a series of still images
# create discrete-image gif
convert -delay 20 flow_map_*.png -loop 0 flow_map.gif

# create smooth-blended gif
convert -delay 5 flow_map_*.png -loop 0 -morph 5 flow_map_smooth.gif
On windows, the ‘portable’ version doesn’t need admin rights: e.g. if the zip is extracted to
Users\<username>\bin\imagemagick, replace convert with
%USERPROFILE%\bin\imagemagick\convert.exe
More Workflow pointers
Two overview papers from Wilson et al:
Best practices for scientific computing
Good enough practices in scientific computing
Pandoc
Convert text documents from one format to another - markdown/HTML/Word/LaTeX…
Project layout
Main ideas:
- have a README that introduces the project
- be explicit about licensing (how to choose a license
- keep the source data
CITATION
README
LICENSE
requirements.txt
data
 |-- birds_count_table.csv
data_as_provided
 |-- SOURCES.md
 |-- ConservationAreas2017.zip
docs
 |-- notebook.md
 |-- manuscript.md
 |-- changelog.txt
results
 |-- summarized_results.csv
figures
 |-- map.png
src
 |-- map_sightings.py
 |-- sightings_analysis.py
 |-- runall.py
(adapted from Wilson et al, linked above)
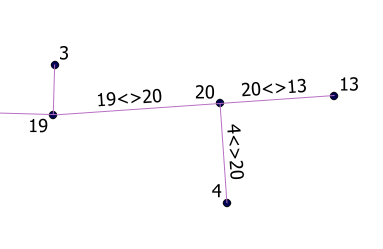
QGIS label rules
Label features using an expression - the line below concatenates the values of the from_id
and to_id attributes to label some network edges, producing labels like 1<>2, 18<>27…
concat(from_id, '<>', to_id)
R
R has been a bit of a de-facto language for stats - lots of good statistics packages, and
ggplot2 is great for charts.
R for Data Science has a nice intro to R and data work:
Re-use code
snkit - a spatial networks toolkit, is an example of package that’s work in progress. The aim is to collect together bits of code that are often useful for data cleaning and are also tricky to get right (handling enough of the edges cases, running reasonably quickly)
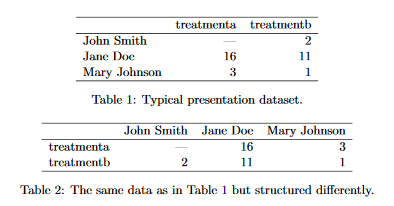
Tidy data
This is a simple but powerful idea about how to organise tabular data:
- Each variable forms a column
- Each observation forms a row
- Each type of observational unit forms a table
Readable paper which sets it out and runs through a few examples:
Untidy examples:
The same dataset, tidied:
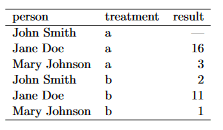
What can we do with tidy data?
- Filter: subsetting or removing observations based on some condition.
- Transform: adding or modifying variables. These modifications can involve either asingle variable (e.g., log-transformation), or multiple variables (e.g., computing density from weight and volume).
- Aggregate: collapsing multiple values into a single value (e.g., by summing or taking means).
- Sort: changing the order of observations
- Visualise: map from values of variables to aesthetic properties of the graph (e.g., position, size, shape and colour)
Use the source
Read open source code
- if you’re stuck when using a library, reading the source code of the method you’re using can let you step down a layer
- learn how projects and libraries are structured, patterns and design choices
Videos
Create videos from stills (good for lots of frames, where GIFs would start to struggle):
# convert pngs to mp4 (change framerate to change presentation speed)
ffmpeg -framerate 10 -i figures/map_%d.png -pix_fmt yuv420p -c:v libx264 figures/map.mp4
Workflow
Think about how to switch tools and add project structure as things grow:
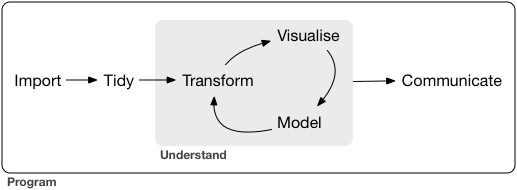
(image from R for data science, linked above)
- Explore data: fire up GIS, Excel, Jupyter notebook
- Write scripts: record/reproduce processing steps, scale up
- Make a project: more structure, collaboration
Zoom around
Handy websites to quickly create or edit spatial data:
Pick a point on a map, in any* coordinate system:
Simplify some spatial data:
Make a GIF:
Compress images:
Draw flowcharts:
Awesome lists: