Constraining layers
Among the layers of data available, some have high granularity and will be used as a rescaling variables to distribute values that would otherwise be uniform in space at a coarser resolution. The idea is to link certain economic activity related variables to some infrastructure and geographic layers, and assuming some form of homogeneity, distribute the economic activity proportionally to the the distribution, say, of infrastrucutre in a location. This notebook will lay some basis for this.
#Base
import itertools as iter
import os
import re
import math
import numpy as np
import random as rd
import glob
import dask
# data engineering
import h3
import shapely as shp
import geopandas as gpd
import pandas as pd
import rioxarray as rx
import osmnx as ox
import pyarrow
import ibis as ib
from ibis import _
ib.options.interactive = True
import ibis.selectors as s
# import polars as pl
# scalenav modules
import scalenav.scale_nav as sd
import scalenav.data as dt
from scalenav.plotting import cmap
import scalenav.rast_converter as snr
### Visualisation
from IPython.display import display
import ipywidgets
import pydeck as pdk
from matplotlib import pyplot as plt
import seaborn as sns
import pypalettes as pypal
Using angles for meter grid.
Using angles for meter grid.
Using angles for meter grid.
Using angles for meter grid.
Using angles for meter grid.
Relevant docs
To get more familiar with the different tools used throughout this and other notebooks related to the package, refer to the following list:
ddb spatial extension web: https://duckdb.org/docs/extensions/spatial.html
ddb spatial extension github functions ref: https://github.com/duckdb/duckdb_spatial/blob/main/docs/functions.md
H3 + duckdb extension : https://github.com/isaacbrodsky/h3-duckdb
ibis + geospatial :
general : https://ibis-project.org/reference/expression-tables#attributes
blogpost : https://ibis-project.org/posts/ibis-duckdb-geospatial/#functions-supported-and-next-steps
functions ref : https://ibis-project.org/reference/expression-geospatial
Base layers: agriculture
This also covers the example of reading in a bunch of layers with different variables covering an overlapping region and combining them.
# location of the raw data folder for mapspam
agri_folder = "/Users/cenv1069/Documents/data/datasets/mapspam/dataverse_files/Global_Geotiff/spam2020V1r0_global_harvested_area"
# all files in the folder
agriculture_files = glob.glob(f"{agri_folder}/**")
print(len(agriculture_files))
agriculture_files[0:4]
138
['/Users/cenv1069/Documents/data/datasets/mapspam/dataverse_files/Global_Geotiff/spam2020V1r0_global_harvested_area/spam2020_v1r0_global_H_OOIL_R.tif',
'/Users/cenv1069/Documents/data/datasets/mapspam/dataverse_files/Global_Geotiff/spam2020V1r0_global_harvested_area/spam2020_v1r0_global_H_RAPE_R.tif',
'/Users/cenv1069/Documents/data/datasets/mapspam/dataverse_files/Global_Geotiff/spam2020V1r0_global_harvested_area/spam2020_v1r0_global_H_OFIB_I.tif',
'/Users/cenv1069/Documents/data/datasets/mapspam/dataverse_files/Global_Geotiff/spam2020V1r0_global_harvested_area/spam2020_v1r0_global_H_COFF_R.tif']
# getting the raster files by looking at the file extensions in the folder.
agri_tiffs = [x for x in glob.glob(f"{agri_folder}/**",recursive=True) if re.search(pattern=".tif$",string=x)]
print(len(agri_tiffs))
agri_tiffs[0:4]
138
['/Users/cenv1069/Documents/data/datasets/mapspam/dataverse_files/Global_Geotiff/spam2020V1r0_global_harvested_area/spam2020_v1r0_global_H_OOIL_R.tif',
'/Users/cenv1069/Documents/data/datasets/mapspam/dataverse_files/Global_Geotiff/spam2020V1r0_global_harvested_area/spam2020_v1r0_global_H_RAPE_R.tif',
'/Users/cenv1069/Documents/data/datasets/mapspam/dataverse_files/Global_Geotiff/spam2020V1r0_global_harvested_area/spam2020_v1r0_global_H_OFIB_I.tif',
'/Users/cenv1069/Documents/data/datasets/mapspam/dataverse_files/Global_Geotiff/spam2020V1r0_global_harvested_area/spam2020_v1r0_global_H_COFF_R.tif']
# known grid parameter of the data.
grid_param = 10_000
# folder and filename to write ingested data into.
out_folder = "/Users/cenv1069/Documents/data/datasets/mapspam/"
out_filename = f'spam2020_harvested_area.parquet'
out_file = f"{out_folder}/{out_filename}"
# if processed data already exists, read it in.
if os.path.exists(out_file):
print(f"Reading existing file '{out_file}'")
raw_grid = pd.read_parquet(out_file)
else :
print("Ingesting raw data.")
snr.rast_converter(in_path=agri_tiffs,out_path=out_file)
raw_grid = pd.read_parquet(out_file)
Reading existing file '/Users/cenv1069/Documents/data/datasets/mapspam//spam2020_harvested_area.parquet'
# this step should not be necessary as the data ingested is already filtered of all unnecessary bits.
raw_grid.dropna(subset="band_var",inplace=True)
raw_grid.reset_index(inplace=True,drop=True)
# print(raw_grid.shape)
# raw_grid.head()
# raw_grid.sample(n=20_000).explore()
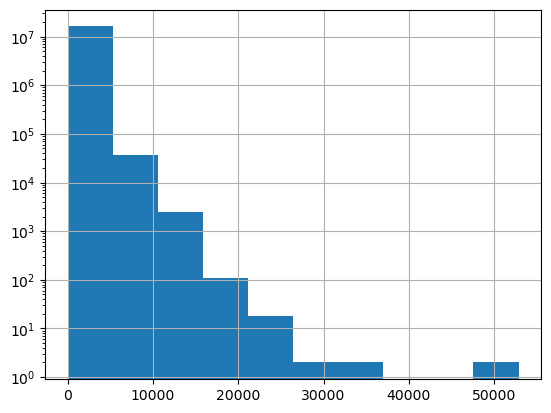
ghsl_df = raw_grid[["band_var","lon","lat"]]
ghsl_df.band_var.hist(log=True)
<Axes: >
H3 + duckdb scale up
conn = ib.connect("duckdb://")
# loading the h3 extension
res = conn.raw_sql("""INSTALL h3 FROM community;
LOAD h3;""").df()
# loading the spatial extension.
res = conn.raw_sql("install spatial; load spatial").df()
| Success |
|---|
H3 and grid parameters
Reading econ activity data
dose_wdi_geo_file = "/Users/cenv1069/Documents/data/datasets/local_data/dose-wdi/0_3/dose_wdi_geo.parquet"
dwg = conn.read_parquet(dose_wdi_geo_file,table_name="dwg")
dwg.head()
┏━━━━━━━━┳━━━━━━━━━┳━━━━━━━━━┳━━━━━━━━━━━━━━┳━━━━━━━━━━━━━━━━━━━┳━━━━━━━━━━━━━━━━━━━━━━━━┳━━━━━━━━━━━━━━━━━━━━━━┳━━━━━━━━━━━━━━━━━━━━━━━━━━━━━━━━━━━━━━━━━━━━━━━━━━━━━━━━━━━━━━━━━┳━━━━━━━━━━━━━━━━━━━━━━━━━━━━━━━━━━━━━━━━━━━━━━━━━━━━━━━━━━━━━━━━━━━━━━━━━━━━━━━━━━━━━━━━━━━━━━━━━━━━━━━━━━━━━━━━━━━━━━━━━━━━━━━━━━━━━━━━━━━━━━━━━━━━━━━━━━━━━━━━━━━━━━━━━━━━━━━━━━━━━━━━━━━━━━━━━━━━━━━━━━━━━━━━━━━━━━━━━━━━━━━━━━━━━━━━━━━━━┳━━━━━━━━━━━━━━━━━━━┳━━━━━━━━━━━┳━━━━━━━━━━━┳━━━━━━━━━━━┓ ┃ gid_0 ┃ country ┃ gid_1 ┃ grp_usd_2015 ┃ services_usd_2015 ┃ manufacturing_usd_2015 ┃ agriculture_usd_2015 ┃ centr ┃ geometry ┃ color ┃ radius ┃ x ┃ y ┃ ┡━━━━━━━━╇━━━━━━━━━╇━━━━━━━━━╇━━━━━━━━━━━━━━╇━━━━━━━━━━━━━━━━━━━╇━━━━━━━━━━━━━━━━━━━━━━━━╇━━━━━━━━━━━━━━━━━━━━━━╇━━━━━━━━━━━━━━━━━━━━━━━━━━━━━━━━━━━━━━━━━━━━━━━━━━━━━━━━━━━━━━━━━╇━━━━━━━━━━━━━━━━━━━━━━━━━━━━━━━━━━━━━━━━━━━━━━━━━━━━━━━━━━━━━━━━━━━━━━━━━━━━━━━━━━━━━━━━━━━━━━━━━━━━━━━━━━━━━━━━━━━━━━━━━━━━━━━━━━━━━━━━━━━━━━━━━━━━━━━━━━━━━━━━━━━━━━━━━━━━━━━━━━━━━━━━━━━━━━━━━━━━━━━━━━━━━━━━━━━━━━━━━━━━━━━━━━━━━━━━━━━━━╇━━━━━━━━━━━━━━━━━━━╇━━━━━━━━━━━╇━━━━━━━━━━━╇━━━━━━━━━━━┩ │ string │ string │ string │ float64 │ float64 │ float64 │ float64 │ binary │ binary │ array<int64> │ float64 │ float64 │ float64 │ ├────────┼─────────┼─────────┼──────────────┼───────────────────┼────────────────────────┼──────────────────────┼─────────────────────────────────────────────────────────────────┼─────────────────────────────────────────────────────────────────────────────────────────────────────────────────────────────────────────────────────────────────────────────────────────────────────────────────────────────────────────────┼───────────────────┼───────────┼───────────┼───────────┤ │ ALB │ Albania │ ALB.1_1 │ 4.341915e+08 │ 2.009631e+08 │ 9.449606e+07 │ 8.588401e+07 │ b'\x01\x01\x00\x00\x00@\xa0\x88\x02=\x174@\x9d\xa3\xc5\xb3rPD@' │ b'\x01\x03\x00\x00\x00\x01\x00\x00\x00\xbe\x02\x00\x00\x07h\x11@ a4@\xd3\xa9\x02 \xb47D@\xcd\x15\x10 d`4@\xc4G\xfe?\xd27D@\xa0*\xf0_j_4@\xd8\x98\xf8\x1f\xf07D@$\xb3\xfe\xbf\x7f^4@.:\xf6?\x028D@\x88\xce\xf8'+11165 │ [238, 97, ... +2] │ 19.888996 │ 20.090775 │ 40.628500 │ │ ALB │ Albania │ ALB.2_1 │ 3.719427e+08 │ 1.721516e+08 │ 8.094841e+07 │ 7.357106e+07 │ b'\x01\x01\x00\x00\x00\xe6M\xcan\xe1?4@\x87\xf1\xed\xcdg\xcbD@' │ b'\x01\x03\x00\x00\x00\x01\x00\x00\x00\xbb\x02\x00\x00\xa0\x16\x07\xc0\rl4@\xf5\x0e\xf9_\x15\xa4D@\xdfC\x15@)l4@u\xe3\xfe\x9f\x1a\xa4D@\x1f\x99\xf5\xff\xfdk4@:\xa9\xf5\x9f1\xa4D@\xb5O\t\x80\xd8k4@\xab\xc4\x02\x80_\xa4D@\x9fY\x12'+11117 │ [238, 97, ... +2] │ 19.734250 │ 20.249534 │ 41.589105 │ │ ALB │ Albania │ ALB.3_1 │ 1.113524e+09 │ 5.153885e+08 │ 2.423439e+08 │ 2.202575e+08 │ b'\x01\x01\x00\x00\x00\xb5?\xc3\x1e`\xa13@\x14\x15\xcd2B\xb9D@' │ b'\x01\x03\x00\x00\x00\x01\x00\x00\x00\x8f\x0c\x00\x00\xb3@\xfd_\\\xa33@9\xad\x04 \xa8\xabD@\x85\x1a\xf0\xbf\xb6\xa23@\x13U\t`\x14\xabD@~r\x14 \n\xa33@+\xf0\xfc?\xda\xaaD@\xa8O\xf6\xbf\xf1\xa33@\xd1\x9a\xf6\xff7\xaaD@\xc0@\x10'+51373 │ [238, 97, ... +2] │ 20.830796 │ 19.630373 │ 41.447333 │ │ ALB │ Albania │ ALB.4_1 │ 7.954835e+08 │ 3.681851e+08 │ 1.731265e+08 │ 1.573483e+08 │ b'\x01\x01\x00\x00\x00\x17\xb66{\xbb/4@m\xda[\xa0\x1f\x85D@' │ b'\x01\x03\x00\x00\x00\x01\x00\x00\x00\xc5\x02\x00\x00\xe3\xe0\xf3?\xd0o4@\xe3\xa1\xf7\xdf\xadlD@ti\x15`\xcco4@\xb0\xb3\xf8\x7f\x9blD@A\x93\x0e \x8dp4@\x1f\x03\x05 flD@\xd8E\x13 \xf1p4@\xd5\x0f\x03\xc0\xa5kD@\xa6,\x01'+11277 │ [238, 97, ... +2] │ 20.494461 │ 20.186454 │ 41.040028 │ │ ALB │ Albania │ ALB.5_1 │ 1.345159e+09 │ 6.225993e+08 │ 2.927561e+08 │ 2.660753e+08 │ b"\x01\x01\x00\x00\x00\xee\x16g\xe7\xda\x9e3@Y\x90\xfc/'cD@" │ b'\x01\x03\x00\x00\x00\x01\x00\x00\x00,\n\x00\x00x\x06\xf4_s\xbe3@\xfc\x0c\xfb\x7f\xcd9D@+\xb1\x00\xe0\xb7\xbe3@\x8c\xc1\xfd_y:D@\xf2.\x0f\x80U\xbe3@\x159\x02\xc0\xca:D@\xdf\xed\xee\xbf\x9d\xbd3@\xf6\xb7\x04\xe0\x1f;D@,B\x14'+41597 │ [238, 97, ... +2] │ 21.019778 │ 19.620528 │ 40.774633 │ └────────┴─────────┴─────────┴──────────────┴───────────────────┴────────────────────────┴──────────────────────┴─────────────────────────────────────────────────────────────────┴─────────────────────────────────────────────────────────────────────────────────────────────────────────────────────────────────────────────────────────────────────────────────────────────────────────────────────────────────────────────┴───────────────────┴───────────┴───────────┴───────────┘
conn.list_tables()
['dwg']
# conn.drop_view("ghsl_h3_",force=True)
# # conn.drop_view("ghsl_h3",force=True)
print("Assuming raster grid resolution :",grid_param)
h3_res = dt.rast_to_h3[str(grid_param)]["h3_res"]
print("Using base H3 resolution : ", h3_res)
res = conn.raw_sql(f"""create or replace view ghsl_h3_ as
(select
band_var,
h3_h3_to_string(h3_latlng_to_cell(lat,lon,{h3_res})) as h3_id,
lon,
lat
from ghsl_df);""")
res.df()
Assuming raster grid resolution : 10000
Using base H3 resolution : 8
| Count |
|---|
ghsl_h3_ = conn.table("ghsl_h3_")
print(ghsl_h3_.count())
ghsl_h3_.head()
┌──────────┐
│ 16141803 │
└──────────┘
┏━━━━━━━━━━━┳━━━━━━━━━━━━━━━━━┳━━━━━━━━━━━┳━━━━━━━━━━┓ ┃ band_var ┃ h3_id ┃ lon ┃ lat ┃ ┡━━━━━━━━━━━╇━━━━━━━━━━━━━━━━━╇━━━━━━━━━━━╇━━━━━━━━━━┩ │ float32 │ string │ float32 │ float32 │ ├───────────┼─────────────────┼───────────┼──────────┤ │ 23.100000 │ 88120cd999fffff │ -116.3125 │ 58.46875 │ │ 23.000000 │ 88120cc145fffff │ -116.1875 │ 58.46875 │ │ 27.299999 │ 88120cc15bfffff │ -116.1250 │ 58.46875 │ │ 30.200001 │ 88120cc001fffff │ -116.0625 │ 58.46875 │ │ 24.100000 │ 88120ccabdfffff │ -116.1875 │ 58.37500 │ └───────────┴─────────────────┴───────────┴──────────┘
ghsl_h3_.h3_id.nunique()
┌────────┐
│ 502185 │
└────────┘
ghsl_h3 = conn.create_view("ghsl_h3",
obj=(ghsl_h3_.group_by("h3_id").agg(band=_.band_var.sum(),
x=_.lon.first(),
y=_.lat.first())
),
overwrite=True,
)
conn.sql("select count(*) as N from ghsl_h3;")
┏━━━━━━━━┓ ┃ N ┃ ┡━━━━━━━━┩ │ int64 │ ├────────┤ │ 502185 │ └────────┘
conn.list_tables()
['dwg', 'ghsl_h3', 'ghsl_h3_']
Coordinates to plot only points
# h3_layer_ghsl_h3 = pdk.Layer(
# "H3HexagonLayer",
# ghsl_h3.execute(limit=10_000),
# pickable=True,
# stroked=True,
# filled=True,
# opacity=1,
# extruded=False,
# get_hexagon= "h3_id",
# get_fill_color = [200,200,100,255],
# get_line_color=[0, 0, 0, 100],
# line_width_min_pixels=0,
# line_width_max_pixels=1,
# )
# points_layer = pdk.Layer(
# "ScatterplotLayer",
# ghsl_h3.execute(limit=10_000),
# pickable=False,
# opacity=0.8,
# stroked=False,
# filled=True,
# radius_scale=1,
# radius_min_pixels=1,
# radius_max_pixels=20,
# line_width_min_pixels=1,
# get_position = ["lon","lat"],
# get_radius=50,
# get_fill_color=[255, 140, 0, 255],
# get_line_color=[0, 0, 0, 0],
# )
# view_state_global = pdk.data_utils.compute_view(ghsl_df[["lon","lat"]])
# # Create mapdeck object
# deck_map_ghsl_h3 = pdk.Deck(layers=[
# # h3_layer_ghsl_h3,
# points_layer
# ]
# ,initial_view_state=view_state_global
# ,tooltip= {"text": "Value : {band}"}
# ,map_style="road"
# )
# deck_map_ghsl_h3.to_html("../../deck_maps/deck_ghsl_h3_grid.html",
# iframe_height=800,
# # open_browser=False
# )
Selecting an area
dwg.filter(_.country.re_search("Nigeria")).select("gid_0","country")
┏━━━━━━━━┳━━━━━━━━━┓ ┃ gid_0 ┃ country ┃ ┡━━━━━━━━╇━━━━━━━━━┩ │ string │ string │ ├────────┼─────────┤ │ NGA │ Nigeria │ │ NGA │ Nigeria │ │ NGA │ Nigeria │ │ NGA │ Nigeria │ │ NGA │ Nigeria │ │ NGA │ Nigeria │ │ NGA │ Nigeria │ │ NGA │ Nigeria │ │ NGA │ Nigeria │ │ NGA │ Nigeria │ │ … │ … │ └────────┴─────────┘
selected_country = "NGA"
Rescaling approach to econ data
country = conn.sql(f"""
SELECT sel_country.* EXCLUDE (color,centr,geom,radius,x,y,grp_usd_2015,services_usd_2015,manufacturing_usd_2015),
ghsl.*
FROM ghsl_h3 AS ghsl
JOIN (SELECT * EXCLUDE geometry, ST_GeomFromWKB(geometry) as geom FROM dwg where gid_0='{selected_country}') AS sel_country
ON ST_Intersects(ST_Point(ghsl.x,ghsl.y),sel_country.geom);
""")
# where gid_0='{selected_country}'
print(country.count())
country.head(3)
┌──────┐
│ 4362 │
└──────┘
┏━━━━━━━━┳━━━━━━━━━┳━━━━━━━━━━┳━━━━━━━━━━━━━━━━━━━━━━┳━━━━━━━━━━━━━━━━━┳━━━━━━━━━━━━━━┳━━━━━━━━━━┳━━━━━━━━━━━┓ ┃ gid_0 ┃ country ┃ gid_1 ┃ agriculture_usd_2015 ┃ h3_id ┃ band ┃ x ┃ y ┃ ┡━━━━━━━━╇━━━━━━━━━╇━━━━━━━━━━╇━━━━━━━━━━━━━━━━━━━━━━╇━━━━━━━━━━━━━━━━━╇━━━━━━━━━━━━━━╇━━━━━━━━━━╇━━━━━━━━━━━┩ │ string │ string │ string │ float64 │ string │ float64 │ float32 │ float32 │ ├────────┼─────────┼──────────┼──────────────────────┼─────────────────┼──────────────┼──────────┼───────────┤ │ NGA │ Nigeria │ NGA.20_1 │ 2.325922e+09 │ 88580a66a7fffff │ 18247.799843 │ 9.039062 │ 11.960938 │ │ NGA │ Nigeria │ NGA.18_1 │ 2.143236e+09 │ 8858e4b299fffff │ 18354.800185 │ 9.625000 │ 11.875000 │ │ NGA │ Nigeria │ NGA.37_1 │ 1.815483e+09 │ 8858116ee1fffff │ 17755.399993 │ 5.707031 │ 11.789062 │ └────────┴─────────┴──────────┴──────────────────────┴─────────────────┴──────────────┴──────────┴───────────┘
gid_1_band = country.group_by("gid_1").agg(total_band=_.band.sum())
gid_1_band
┏━━━━━━━━━━┳━━━━━━━━━━━━━━┓ ┃ gid_1 ┃ total_band ┃ ┡━━━━━━━━━━╇━━━━━━━━━━━━━━┩ │ string │ float64 │ ├──────────┼──────────────┤ │ NGA.16_1 │ 3.496555e+06 │ │ NGA.6_1 │ 5.390292e+05 │ │ NGA.20_1 │ 3.903990e+06 │ │ NGA.15_1 │ 1.632963e+06 │ │ NGA.30_1 │ 2.496919e+06 │ │ NGA.18_1 │ 2.958743e+06 │ │ NGA.5_1 │ 4.136810e+06 │ │ NGA.19_1 │ 5.567422e+06 │ │ NGA.10_1 │ 2.713233e+06 │ │ NGA.33_1 │ 3.040220e+06 │ │ … │ … │ └──────────┴──────────────┘
country_gdf = (country
.join(gid_1_band,country.gid_1==gid_1_band.gid_1,how="left")
.mutate(band_frac=_.band/_.total_band)
# .mutate(h3_id_gdp=_.band_frac*_.build_gdp)
).to_pandas()
print(country_gdf.shape)
country_gdf.head()
(4362, 11)
| gid_0 | country | gid_1 | agriculture_usd_2015 | h3_id | band | x | y | gid_1_right | total_band | band_frac | |
|---|---|---|---|---|---|---|---|---|---|---|---|
| 0 | NGA | Nigeria | NGA.18_1 | 2.143236e+09 | 8858094525fffff | 17909.000036 | 10.125000 | 12.960938 | NGA.18_1 | 2.958743e+06 | 0.006053 |
| 1 | NGA | Nigeria | NGA.18_1 | 2.143236e+09 | 8858086a8dfffff | 18150.799763 | 9.289062 | 12.789062 | NGA.18_1 | 2.958743e+06 | 0.006135 |
| 2 | NGA | Nigeria | NGA.18_1 | 2.143236e+09 | 88580868adfffff | 18191.200068 | 9.289062 | 12.710938 | NGA.18_1 | 2.958743e+06 | 0.006148 |
| 3 | NGA | Nigeria | NGA.37_1 | 1.815483e+09 | 88581cbac9fffff | 17776.599985 | 6.707031 | 12.625000 | NGA.37_1 | 3.997806e+06 | 0.004447 |
| 4 | NGA | Nigeria | NGA.37_1 | 1.815483e+09 | 885811a4c3fffff | 16864.200132 | 5.957031 | 12.539062 | NGA.37_1 | 3.997806e+06 | 0.004218 |
# gpd.GeoSeries(country_gdf[["x","y"]].sample(1000).apply(shp.Point,axis=1),crs="EPSG:4326").explore()
Check that things add up
country_gdf[["gid_1","band_frac"]].groupby("gid_1").agg("sum").head()
| band_frac | |
|---|---|
| gid_1 | |
| NGA.10_1 | 1.0 |
| NGA.11_1 | 1.0 |
| NGA.12_1 | 1.0 |
| NGA.13_1 | 1.0 |
| NGA.15_1 | 1.0 |
Mapping
import scalenav.plotting as snplt
col_pal = "viridis"
col_pal = pypal.load_cmap(col_pal)
cols = snplt.cmap((country_gdf.band),palette=col_pal) #pd.Series([[255*j for j in x] for x in bmlunge(compact_geo_downscaled["log_value"])])
country_gdf["color"] = cols
country_gdf.head(3)
# print(cols)
# print(unique_vals)
Max input : 125467.20, palette colors : 10
| gid_0 | country | gid_1 | agriculture_usd_2015 | h3_id | band | x | y | gid_1_right | total_band | band_frac | color | |
|---|---|---|---|---|---|---|---|---|---|---|---|---|
| 0 | NGA | Nigeria | NGA.18_1 | 2.143236e+09 | 8858094525fffff | 17909.000036 | 10.125000 | 12.960938 | NGA.18_1 | 2.958743e+06 | 0.006053 | [67, 62, 133, 255] |
| 1 | NGA | Nigeria | NGA.18_1 | 2.143236e+09 | 8858086a8dfffff | 18150.799763 | 9.289062 | 12.789062 | NGA.18_1 | 2.958743e+06 | 0.006135 | [67, 62, 133, 255] |
| 2 | NGA | Nigeria | NGA.18_1 | 2.143236e+09 | 88580868adfffff | 18191.200068 | 9.289062 | 12.710938 | NGA.18_1 | 2.958743e+06 | 0.006148 | [67, 62, 133, 255] |
view_state = pdk.data_utils.compute_view(points=country_gdf[["x","y"]])
# # this map is not really usefull at high resolutions
# h3_layer_down = pdk.Layer(
# "H3HexagonLayer",
# country_gdf[["gid_0","gid_1","h3_id","total_band","color"]],
# pickable=True,
# stroked=True,
# filled=True,
# opacity=.8,
# extruded=False,
# get_hexagon= "h3_id",
# get_fill_color = "color",
# get_line_color= [0, 0, 0, 100],
# line_width_min_pixels=0,
# line_width_max_pixels=1,
# )
# layer_down = pdk.Layer(
# "ScatterplotLayer",
# country_gdf[["x","y"]],
# pickable=False,
# opacity=0.4,
# stroked=False,
# filled=True,
# radius_scale=6,
# radius_min_pixels=1,
# radius_max_pixels=10,
# line_width_min_pixels=1,
# get_position = ["x","y"],
# get_radius=50,
# get_fill_color=[255, 140, 0, 255],
# get_line_color=[0, 0, 0, 0],
# )
# # Create mapdeck object
# deck_map_down = pdk.Deck(layers=[
# h3_layer_down,
# layer_down
# ]
# ,initial_view_state=view_state
# # ,tooltip= {"text": "Value : {h3_id_gdp}"}
# ,height=800
# ,map_style="road"
# )
# deck_map_down.to_html("../../deck_maps/deck_ghsl_h3_down_grid.html")
Gridding
rast_to_h3 = dt.rast_to_h3_map(x=country_gdf["x"].mean(),y = country_gdf["y"].mean())
Using angles for meter grid.
Using angles for meter grid.
Using angles for meter grid.
Using angles for meter grid.
Using angles for meter grid.
# ideally, this is precomputed, but for some reason it has not worked...
neighbs = rast_to_h3[str(grid_param)]["nn"]
country_gdf["h3_gridded"] = pd.Series(country_gdf.apply(lambda row: dt.centre_cell_to_square(h3_cell = row["h3_id"],neighbs=neighbs),axis=1).tolist())
country_gdf.dropna(subset=["h3_gridded"],inplace=True)
Gridded data set
ghsl_gridded = country_gdf.explode("h3_gridded")
print(ghsl_gridded.shape)
ghsl_gridded.head(3)
(649938, 13)
| gid_0 | country | gid_1 | agriculture_usd_2015 | h3_id | band | x | y | gid_1_right | total_band | band_frac | color | h3_gridded | |
|---|---|---|---|---|---|---|---|---|---|---|---|---|---|
| 0 | NGA | Nigeria | NGA.18_1 | 2.143236e+09 | 8858094525fffff | 17909.000036 | 10.125 | 12.960938 | NGA.18_1 | 2.958743e+06 | 0.006053 | [67, 62, 133, 255] | 88580940bdfffff |
| 0 | NGA | Nigeria | NGA.18_1 | 2.143236e+09 | 8858094525fffff | 17909.000036 | 10.125 | 12.960938 | NGA.18_1 | 2.958743e+06 | 0.006053 | [67, 62, 133, 255] | 8858094539fffff |
| 0 | NGA | Nigeria | NGA.18_1 | 2.143236e+09 | 8858094525fffff | 17909.000036 | 10.125 | 12.960938 | NGA.18_1 | 2.958743e+06 | 0.006053 | [67, 62, 133, 255] | 8858094ee9fffff |
ghsl_gridded = ghsl_gridded[~ghsl_gridded.duplicated(subset=["h3_gridded"])]
print(ghsl_gridded.shape)
ghsl_gridded.reset_index(inplace=True,drop=True)
(567557, 13)
ghsl_gridded.head(3)
| gid_0 | country | gid_1 | agriculture_usd_2015 | h3_id | band | x | y | gid_1_right | total_band | band_frac | color | h3_gridded | |
|---|---|---|---|---|---|---|---|---|---|---|---|---|---|
| 0 | NGA | Nigeria | NGA.18_1 | 2.143236e+09 | 8858094525fffff | 17909.000036 | 10.125 | 12.960938 | NGA.18_1 | 2.958743e+06 | 0.006053 | [67, 62, 133, 255] | 88580940bdfffff |
| 1 | NGA | Nigeria | NGA.18_1 | 2.143236e+09 | 8858094525fffff | 17909.000036 | 10.125 | 12.960938 | NGA.18_1 | 2.958743e+06 | 0.006053 | [67, 62, 133, 255] | 8858094539fffff |
| 2 | NGA | Nigeria | NGA.18_1 | 2.143236e+09 | 8858094525fffff | 17909.000036 | 10.125 | 12.960938 | NGA.18_1 | 2.958743e+06 | 0.006053 | [67, 62, 133, 255] | 8858094ee9fffff |
ghsl_gridded.set_index("h3_id",inplace=True,drop=True)
# ghsl_gridded = ghsl_gridded.join(ghsl_gridded.value_counts("h3_id"),how="left",sort=False,validate="m:1")
ghsl_gridded["count"] = ghsl_gridded.groupby("h3_id")["gid_1"].transform("count")
# ghsl_gridded["h3_id_gdp_gridded"] = np.round(ghsl_gridded["h3_id_gdp"]/ghsl_gridded["count"])
ghsl_gridded["h3_id_band_gridded"] = np.round(ghsl_gridded["band"]/ghsl_gridded["count"])
ghsl_gridded.reset_index(inplace=True,drop=False)
print(ghsl_gridded.shape)
ghsl_gridded.head(3)
(567557, 15)
| h3_id | gid_0 | country | gid_1 | agriculture_usd_2015 | band | x | y | gid_1_right | total_band | band_frac | color | h3_gridded | count | h3_id_band_gridded | |
|---|---|---|---|---|---|---|---|---|---|---|---|---|---|---|---|
| 0 | 8858094525fffff | NGA | Nigeria | NGA.18_1 | 2.143236e+09 | 17909.000036 | 10.125 | 12.960938 | NGA.18_1 | 2.958743e+06 | 0.006053 | [67, 62, 133, 255] | 88580940bdfffff | 149 | 120.0 |
| 1 | 8858094525fffff | NGA | Nigeria | NGA.18_1 | 2.143236e+09 | 17909.000036 | 10.125 | 12.960938 | NGA.18_1 | 2.958743e+06 | 0.006053 | [67, 62, 133, 255] | 8858094539fffff | 149 | 120.0 |
| 2 | 8858094525fffff | NGA | Nigeria | NGA.18_1 | 2.143236e+09 | 17909.000036 | 10.125 | 12.960938 | NGA.18_1 | 2.958743e+06 | 0.006053 | [67, 62, 133, 255] | 8858094ee9fffff | 149 | 120.0 |
# view_state = pdk.data_utils.compute_view(points=ghsl_gridded.sample(10000)["h3_gridded"].apply(lambda cell: h3.cell_to_latlng(cell)[::-1]))
# lagos: latitude = 6.450151,longitude = 3.531193 !!!! DOES NOT WORK BECAUSE IT IS EXCLUDED FROM DOSE!!!
# Abidjan : latitude = 5.367, longitude = -4.009
# Kano : latitude = 11.985, longitude = 8.533
zoom_lat=11.985
zoom_lon=8.533
zoom_width=70_000
view_state_zoomed = pdk.ViewState(latitude = zoom_lat,longitude = zoom_lon,zoom=11,pitch=30,bearing=0)
# extracting data for the plotting region :
plotting_region = dt.square_poly(lat=zoom_lat,lon=zoom_lon,distance=zoom_width)
# gpd.GeoSeries(plotting_region,crs="EPSG:4326").explore()
Using angles for arc grid.
limits = [np.round(x,3) for x in plotting_region.bounds]
limits
[8.212, 11.664, 8.854, 12.306]
# ghsl_gridded
ghsl_gridded_zoom = conn.sql(
f"""
Select * from
(select *,
array_extract(h3_cell_to_latlng(h3_gridded),2) as x_h3,
array_extract(h3_cell_to_latlng(h3_gridded),1) as y_h3
from ghsl_gridded)
where (x <= {limits[2]}) and (x >= {limits[0]}) and (y <= {limits[3]}) and (y >= {limits[1]});
""").execute()
print(ghsl_gridded_zoom.shape)
ghsl_gridded_zoom.head(3)
(6475, 17)
| h3_id | gid_0 | country | gid_1 | agriculture_usd_2015 | band | x | y | gid_1_right | total_band | band_frac | color | h3_gridded | count | h3_id_band_gridded | x_h3 | y_h3 | |
|---|---|---|---|---|---|---|---|---|---|---|---|---|---|---|---|---|---|
| 0 | 88580a0b3bfffff | NGA | Nigeria | NGA.20_1 | 2.325922e+09 | 17891.99997 | 8.625 | 12.210938 | NGA.20_1 | 3.903990e+06 | 0.004583 | [67, 62, 133, 255] | 88580a0b45fffff | 149 | 120.0 | 10.089947 | 12.989684 |
| 1 | 88580a0b3bfffff | NGA | Nigeria | NGA.20_1 | 2.325922e+09 | 17891.99997 | 8.625 | 12.210938 | NGA.20_1 | 3.903990e+06 | 0.004583 | [67, 62, 133, 255] | 88580a0841fffff | 149 | 120.0 | 10.154550 | 12.977034 |
| 2 | 88580a0b3bfffff | NGA | Nigeria | NGA.20_1 | 2.325922e+09 | 17891.99997 | 8.625 | 12.210938 | NGA.20_1 | 3.903990e+06 | 0.004583 | [67, 62, 133, 255] | 88580a0951fffff | 149 | 120.0 | 10.134508 | 12.938749 |
ghsl_gridded_zoom["color"] = cmap(ghsl_gridded_zoom["h3_id_band_gridded"],palette=col_pal)
Max input : 292.00, palette colors : 10
h3_layer_ghsl_h3_gridded = pdk.Layer(
"H3HexagonLayer",
# ghsl_gridded.loc[0:200_000],
ghsl_gridded_zoom,
pickable=True,
stroked=True,
filled=True,
opacity=.5,
extruded=False,
get_hexagon= "h3_gridded",
get_fill_color = "color",
get_line_color= [0, 0, 0, 100],
line_width_min_pixels=1,
line_width_max_pixels=1,
)
layer_down = pdk.Layer(
"ScatterplotLayer",
country_gdf[["x","y"]],
pickable=False,
opacity=0.8,
stroked=False,
filled=True,
radius_scale=10,
radius_min_pixels=1,
radius_max_pixels=20,
line_width_min_pixels=0,
line_width_max_pixels=0,
get_position = ["x","y"],
get_radius=25,
get_fill_color=[255, 140, 0, 255],
get_line_color=[0, 0, 0, 0],
)
# Create mapdeck object
deck_map_ghsl_h3_gridded = pdk.Deck(layers=[h3_layer_ghsl_h3_gridded,
layer_down
]
,initial_view_state=view_state_zoomed
,tooltip= {"text": "Value : {h3_id_band_gridded}"}
,height=800
,map_style="road"
)
deck_map_ghsl_h3_gridded.to_html("../../deck_maps/deck_ghsl_nres_h3_gridded.html",
# open_browser=True,
iframe_height=800
)
Changing Scales
ghsl_rescaled = ghsl_gridded_zoom.rename(columns={"h3_id_gdp_gridded" : "h3_id_gdp_gridded_var",
"h3_id_band_gridded" : "h3_id_band_gridded_var",
"h3_id" : "h3_gridded_parent"
},inplace=False)
ghsl_rescaled.rename(columns={"h3_gridded" : "h3_id"
},inplace=True)
ghsl_rescaled.head(3)
| h3_gridded_parent | gid_0 | country | gid_1 | agriculture_usd_2015 | band | x | y | gid_1_right | total_band | band_frac | color | h3_id | count | h3_id_band_gridded_var | x_h3 | y_h3 | |
|---|---|---|---|---|---|---|---|---|---|---|---|---|---|---|---|---|---|
| 0 | 88580a0b3bfffff | NGA | Nigeria | NGA.20_1 | 2.325922e+09 | 17891.99997 | 8.625 | 12.210938 | NGA.20_1 | 3.903990e+06 | 0.004583 | [37, 133, 142, 255] | 88580a0b45fffff | 149 | 120.0 | 10.089947 | 12.989684 |
| 1 | 88580a0b3bfffff | NGA | Nigeria | NGA.20_1 | 2.325922e+09 | 17891.99997 | 8.625 | 12.210938 | NGA.20_1 | 3.903990e+06 | 0.004583 | [37, 133, 142, 255] | 88580a0841fffff | 149 | 120.0 | 10.154550 | 12.977034 |
| 2 | 88580a0b3bfffff | NGA | Nigeria | NGA.20_1 | 2.325922e+09 | 17891.99997 | 8.625 | 12.210938 | NGA.20_1 | 3.903990e+06 | 0.004583 | [37, 133, 142, 255] | 88580a0951fffff | 149 | 120.0 | 10.134508 | 12.938749 |
h3_gridded_new_scale = sd.change_res(ghsl_rescaled,level=-1)
print(h3_gridded_new_scale.shape)
h3_gridded_new_scale.head()
(976, 3)
| h3_id | child_cells | h3_id_band_gridded_var | |
|---|---|---|---|
| 0 | 87580a000ffffff | [88580a0007fffff] | 144.0 |
| 1 | 87580a001ffffff | [88580a0017fffff] | 144.0 |
| 2 | 87580a002ffffff | [88580a002bfffff, 88580a0021fffff, 88580a0023f... | 1008.0 |
| 3 | 87580a003ffffff | [88580a003dfffff, 88580a0035fffff, 88580a0037f... | 1008.0 |
| 4 | 87580a006ffffff | [88580a0067fffff] | 144.0 |
h3_gridded_new_scale["color"] = cmap((h3_gridded_new_scale.h3_id_band_gridded_var),palette=col_pal)
Max input : 2044.00, palette colors : 10
#####
h3_layer_ghsl_h3_gridded_new_scale = pdk.Layer(
"H3HexagonLayer",
h3_gridded_new_scale,
pickable=True,
stroked=True,
filled=True,
opacity=.5,
extruded=False,
get_hexagon= "h3_id",
get_fill_color = "color",
get_line_color= [0, 0, 0, 100],
line_width_min_pixels=1,
line_width_max_pixels=1,
)
# Create mapdeck object
deck_map_ghsl_h3_gridded_rescaled = pdk.Deck(layers=[h3_layer_ghsl_h3_gridded_new_scale]
,initial_view_state=view_state_zoomed
,tooltip= {"text": "Value : {h3_id_gdp_gridded_var}"}
,map_style="road"
)
deck_map_ghsl_h3_gridded_rescaled.to_html("../../deck_maps/deck_ghsl_nres_h3_gridded_new_scale.html",
iframe_height=800,
# open_browser=True
)
Adding constraint layer
This time, GHSL data gives a hint at where there is no agricultural lands. Start weith loading in the ghsl layer just like a base layer
grid_ghsl_param = 100
ghsl_file = f"/Users/cenv1069/Documents/data/datasets/JRC/S_{grid_ghsl_param}m_total/**"
# "/Users/cenv1069/Documents/agriculture/ghsl/non_res/**"
# "/Users/cenv1069/Documents/data/datasets/JRC/S_10m/**"
tiffs = [x for x in glob.glob(ghsl_file,recursive=True) if re.search(pattern=".tif$",string=x)]
print(len(tiffs))
tiffs
1
['/Users/cenv1069/Documents/data/datasets/JRC/S_100m_total/GHS_BUILT_S_E2020_GLOBE_R2023A_54009_100_V1_0_R8_C19/GHS_BUILT_S_E2020_GLOBE_R2023A_54009_100_V1_0_R8_C19.tif']
out_folder = "outputs"
out_filename = f'S_{grid_ghsl_param}m_total_raw_grid.parquet'
out_file = f"../../{out_folder}/{out_filename}"
if os.path.exists(out_file):
print("Reading existing file")
raw_grid_constraint = conn.read_parquet(out_file,table_name="raw_grid_constraint_")
else :
print("Converting rasters to centroids.")
raw_grid_constraint = dt.rast_to_centroid(out_file,out_paths=tiffs)
raw_grid_constraint.to_parquet(out_file)
Reading existing file
# raw_grid_constraint[["x","y"]] = (gpd.GeoDataFrame(raw_grid_constraint,geometry=gpd.GeoSeries(raw_grid_constraint.apply(lambda row: shp.Point(row.loc["lon"],row.loc["lat"]),axis=1),crs="ESRI:54009"))
# .to_crs(epsg=4326)
# .get_coordinates())
conn.raw_sql(
"""
create or replace view raw_grid_constraint as
(select
band,
ST_X(geom) as x,
ST_Y(geom) as y
from
(select
band,
ST_Transform(ST_Point(lon,lat), 'ESRI:54009', 'EPSG:4326',true) as geom
from raw_grid_constraint_));""")
<duckdb.duckdb.DuckDBPyConnection at 0x31e1f21b0>
# raw_grid_constraint.drop(columns=["lon","lat"],inplace=True)
raw_grid_constraint = conn.table("raw_grid_constraint")
raw_grid_constraint.head()
┏━━━━━━━━┳━━━━━━━━━━━┳━━━━━━━━━━━┓ ┃ band ┃ x ┃ y ┃ ┡━━━━━━━━╇━━━━━━━━━━━╇━━━━━━━━━━━┩ │ uint16 │ float64 │ float64 │ ├────────┼───────────┼───────────┤ │ 29 │ -0.103859 │ 16.258758 │ │ 92 │ -0.102836 │ 16.258758 │ │ 1094 │ -0.056790 │ 16.258758 │ │ 3917 │ -0.055767 │ 16.258758 │ │ 2795 │ -0.054744 │ 16.258758 │ └────────┴───────────┴───────────┘
print("Assuming constraint raster grid resolution : ",grid_ghsl_param)
h3_res_constraint = dt.rast_to_h3[str(grid_ghsl_param)]["h3_res"]
print("Using base H3 resolution : ", h3_res_constraint)
res = conn.raw_sql(f"""create or replace view ghsl_constraint as
(select
band,
h3_h3_to_string(h3_latlng_to_cell(y,x,{h3_res_constraint})) as h3_id,
x,
y
from raw_grid_constraint);""")
res.df()
Assuming constraint raster grid resolution : 100
Using base H3 resolution : 12
| Count |
|---|
ghsl_constraint = conn.table("ghsl_constraint")
print(ghsl_constraint.count())
ghsl_constraint.head()
┌─────────┐
│ 8084661 │
└─────────┘
┏━━━━━━━━┳━━━━━━━━━━━━━━━━━┳━━━━━━━━━━━┳━━━━━━━━━━━┓ ┃ band ┃ h3_id ┃ x ┃ y ┃ ┡━━━━━━━━╇━━━━━━━━━━━━━━━━━╇━━━━━━━━━━━╇━━━━━━━━━━━┩ │ uint16 │ string │ float64 │ float64 │ ├────────┼─────────────────┼───────────┼───────────┤ │ 29 │ 8c59ac4085583ff │ -0.103859 │ 16.258758 │ │ 92 │ 8c59ac4084655ff │ -0.102836 │ 16.258758 │ │ 1094 │ 8c59ac4546369ff │ -0.056790 │ 16.258758 │ │ 3917 │ 8c59ac454631bff │ -0.055767 │ 16.258758 │ │ 2795 │ 8c59ac45462adff │ -0.054744 │ 16.258758 │ └────────┴─────────────────┴───────────┴───────────┘
ghsl_constraint.head()
┏━━━━━━━━┳━━━━━━━━━━━━━━━━━┳━━━━━━━━━━━┳━━━━━━━━━━━┓ ┃ band ┃ h3_id ┃ x ┃ y ┃ ┡━━━━━━━━╇━━━━━━━━━━━━━━━━━╇━━━━━━━━━━━╇━━━━━━━━━━━┩ │ uint16 │ string │ float64 │ float64 │ ├────────┼─────────────────┼───────────┼───────────┤ │ 29 │ 8c59ac4085583ff │ -0.103859 │ 16.258758 │ │ 92 │ 8c59ac4084655ff │ -0.102836 │ 16.258758 │ │ 1094 │ 8c59ac4546369ff │ -0.056790 │ 16.258758 │ │ 3917 │ 8c59ac454631bff │ -0.055767 │ 16.258758 │ │ 2795 │ 8c59ac45462adff │ -0.054744 │ 16.258758 │ └────────┴─────────────────┴───────────┴───────────┘
ghsl_constraint = conn.sql(
f"""
Select * from
(select *,
from ghsl_constraint)
""").execute()
# where (x <= {limits[2]}) and (x >= {limits[0]}) and (y <= {limits[3]}) and (y >= {limits[1]}) and (band > 3000);
print(ghsl_constraint.shape)
ghsl_constraint.head(3)
(8084661, 4)
| band | h3_id | x | y | |
|---|---|---|---|---|
| 0 | 29 | 8c59ac4085583ff | -0.103859 | 16.258758 |
| 1 | 92 | 8c59ac4084655ff | -0.102836 | 16.258758 |
| 2 | 1094 | 8c59ac4546369ff | -0.056790 | 16.258758 |
Gridding the constraint
rast_to_h3 = dt.rast_to_h3_map(x=ghsl_constraint["x"].mean(),y = ghsl_constraint["y"].mean())
# h3_res = dt.rast_to_h3["100"]["h3_res"]
# square = dt.square_poly(lat=country_gdf.loc[0,"y"],lon=country_gdf.loc[0,"x"],distance=100)
# ref_cell = h3.latlng_to_cell(lat=country_gdf.loc[0,"y"],lng=country_gdf.loc[0,"x"],res=h3_res )
# ref_cell_ij = h3.cell_to_local_ij(origin=ref_cell,h=ref_cell)
# cells = h3.geo_to_cells(square,res=h3_res )
# cells_ij = [h3.cell_to_local_ij(origin=ref_cell,h=cell) for cell in cells]
# neighbs = rast_to_h3["100"]["nn"]
# # [(cell_i-ref_cell_ij[0],cell_j-ref_cell_ij[1]) for (cell_i,cell_j) in cells_ij]
# ####
# neighb_cells = [h3.local_ij_to_cell(origin=ref_cell,i=neighb[0]+ref_cell_ij[0],j=neighb[1]+ref_cell_ij[1]) for neighb in neighbs]
# reconstructed = dt.centre_cell_to_square(ref_cell,grid_param=grid_param,neighbs=neighbs)
Using angles for meter grid.
Using angles for meter grid.
Using angles for meter grid.
Using angles for meter grid.
Using angles for meter grid.
# ideally, this is precomputed, but for some reason it has not worked...
neighbs = rast_to_h3[str(grid_ghsl_param)]["nn"]
ghsl_constraint["h3_gridded"] = pd.Series(ghsl_constraint.apply(lambda row: dt.centre_cell_to_square(h3_cell = row["h3_id"],neighbs=neighbs),axis=1).tolist())
ghsl_constraint.dropna(subset=["h3_gridded"],inplace=True)
Gridded data set
constraint_gridded = ghsl_constraint.explode("h3_gridded")
print(constraint_gridded.shape)
constraint_gridded.head(3)
(1040688, 5)
| band | h3_id | x | y | h3_gridded | |
|---|---|---|---|---|---|
| 0 | 3645 | 8c580acd56d1bff | 8.390598 | 12.305711 | 8c580acd56d51ff |
| 0 | 3645 | 8c580acd56d1bff | 8.390598 | 12.305711 | 8c580acd56c23ff |
| 0 | 3645 | 8c580acd56d1bff | 8.390598 | 12.305711 | 8c580acd56dc9ff |
constraint_gridded_zoom = constraint_gridded[~constraint_gridded.duplicated(subset=["h3_gridded"])].copy()
print(constraint_gridded_zoom.shape)
constraint_gridded_zoom.reset_index(inplace=True,drop=True)
(982865, 5)
constraint_gridded.head(3)
| band | h3_id | x | y | h3_gridded | |
|---|---|---|---|---|---|
| 0 | 3645 | 8c580acd56d1bff | 8.390598 | 12.305711 | 8c580acd56d51ff |
| 0 | 3645 | 8c580acd56d1bff | 8.390598 | 12.305711 | 8c580acd56c23ff |
| 0 | 3645 | 8c580acd56d1bff | 8.390598 | 12.305711 | 8c580acd56dc9ff |
Matching Resolution
bringing the variable layer and the constrain layer to a common resolution
constraint_res = h3.get_resolution(constraint_gridded_zoom.h3_gridded[0])
layer_res = h3.get_resolution(ghsl_gridded_zoom.h3_gridded[0])
print("Constraint res : ",constraint_res,", Layer res: ",layer_res)
Constraint res : 12 , Layer res: 8
Let’s meet somewhere in between.
constraint_gridded_zoom.rename(columns={"h3_id" : "h3_native"
,"h3_gridded" : "h3_id"},inplace=True)
ghsl_gridded_zoom.rename(columns={"h3_id" : "h3_native"
,"h3_gridded" : "h3_id"},inplace=True)
constraint_gridded_zoom.head()
| band | h3_native | x | y | h3_id | |
|---|---|---|---|---|---|
| 0 | 3645 | 8c580acd56d1bff | 8.390598 | 12.305711 | 8c580acd56d51ff |
| 1 | 3645 | 8c580acd56d1bff | 8.390598 | 12.305711 | 8c580acd56c23ff |
| 2 | 3645 | 8c580acd56d1bff | 8.390598 | 12.305711 | 8c580acd56dc9ff |
| 3 | 3645 | 8c580acd56d1bff | 8.390598 | 12.305711 | 8c580acd56c2bff |
| 4 | 3645 | 8c580acd56d1bff | 8.390598 | 12.305711 | 8c580acd56d53ff |
ghsl_gridded_zoom.head()
| h3_native | gid_0 | country | gid_1 | agriculture_usd_2015 | band | x | y | gid_1_right | total_band | band_frac | color | h3_id | count | h3_id_band_gridded | x_h3 | y_h3 | |
|---|---|---|---|---|---|---|---|---|---|---|---|---|---|---|---|---|---|
| 0 | 88580a0b3bfffff | NGA | Nigeria | NGA.20_1 | 2.325922e+09 | 17891.99997 | 8.625 | 12.210938 | NGA.20_1 | 3.903990e+06 | 0.004583 | [37, 133, 142, 255] | 88580a0b45fffff | 149 | 120.0 | 10.089947 | 12.989684 |
| 1 | 88580a0b3bfffff | NGA | Nigeria | NGA.20_1 | 2.325922e+09 | 17891.99997 | 8.625 | 12.210938 | NGA.20_1 | 3.903990e+06 | 0.004583 | [37, 133, 142, 255] | 88580a0841fffff | 149 | 120.0 | 10.154550 | 12.977034 |
| 2 | 88580a0b3bfffff | NGA | Nigeria | NGA.20_1 | 2.325922e+09 | 17891.99997 | 8.625 | 12.210938 | NGA.20_1 | 3.903990e+06 | 0.004583 | [37, 133, 142, 255] | 88580a0951fffff | 149 | 120.0 | 10.134508 | 12.938749 |
| 3 | 88580a0b3bfffff | NGA | Nigeria | NGA.20_1 | 2.325922e+09 | 17891.99997 | 8.625 | 12.210938 | NGA.20_1 | 3.903990e+06 | 0.004583 | [37, 133, 142, 255] | 88580a0913fffff | 149 | 120.0 | 10.155665 | 12.917336 |
| 4 | 88580a0b3bfffff | NGA | Nigeria | NGA.20_1 | 2.325922e+09 | 17891.99997 | 8.625 | 12.210938 | NGA.20_1 | 3.903990e+06 | 0.004583 | [37, 133, 142, 255] | 88580a0a3dfffff | 149 | 120.0 | 10.156221 | 12.998780 |
final_res = 9
constraint_gridded_zoom_rescaled = sd.set_res(constraint_gridded_zoom,final=final_res)
ghsl_gridded_zoom_rescaled = sd.set_res(ghsl_gridded_zoom,final=final_res)
constraint_res = h3.get_resolution(constraint_gridded_zoom_rescaled.h3_id[0])
layer_res = h3.get_resolution(ghsl_gridded_zoom_rescaled.h3_id[0])
print("Constraint res : ",constraint_res,", Layer res: ",layer_res)
Constraint res : 9 , Layer res: 9
print(ghsl_gridded_zoom_rescaled.shape)
ghsl_gridded_zoom_rescaled.head()
(45325, 17)
| h3_native | gid_0 | country | gid_1 | agriculture_usd_2015 | band | x | y | gid_1_right | total_band | band_frac | color | h3_id | count | h3_id_band_gridded | x_h3 | y_h3 | |
|---|---|---|---|---|---|---|---|---|---|---|---|---|---|---|---|---|---|
| 0 | 88580a0b3bfffff | NGA | Nigeria | NGA.20_1 | 2.325922e+09 | 17891.99997 | 8.625 | 12.210938 | NGA.20_1 | 3.903990e+06 | 0.004583 | [37, 133, 142, 255] | 89580a0b443ffff | 149 | 120.0 | 10.089947 | 12.989684 |
| 1 | 88580a0b3bfffff | NGA | Nigeria | NGA.20_1 | 2.325922e+09 | 17891.99997 | 8.625 | 12.210938 | NGA.20_1 | 3.903990e+06 | 0.004583 | [37, 133, 142, 255] | 89580a0b447ffff | 149 | 120.0 | 10.089947 | 12.989684 |
| 2 | 88580a0b3bfffff | NGA | Nigeria | NGA.20_1 | 2.325922e+09 | 17891.99997 | 8.625 | 12.210938 | NGA.20_1 | 3.903990e+06 | 0.004583 | [37, 133, 142, 255] | 89580a0b44bffff | 149 | 120.0 | 10.089947 | 12.989684 |
| 3 | 88580a0b3bfffff | NGA | Nigeria | NGA.20_1 | 2.325922e+09 | 17891.99997 | 8.625 | 12.210938 | NGA.20_1 | 3.903990e+06 | 0.004583 | [37, 133, 142, 255] | 89580a0b44fffff | 149 | 120.0 | 10.089947 | 12.989684 |
| 4 | 88580a0b3bfffff | NGA | Nigeria | NGA.20_1 | 2.325922e+09 | 17891.99997 | 8.625 | 12.210938 | NGA.20_1 | 3.903990e+06 | 0.004583 | [37, 133, 142, 255] | 89580a0b453ffff | 149 | 120.0 | 10.089947 | 12.989684 |
print(constraint_gridded_zoom_rescaled.shape)
constraint_gridded_zoom_rescaled.head()
(8443, 2)
| h3_id | child_cells | |
|---|---|---|
| 0 | 89580a01123ffff | [8a580a011207fff, 8a580a01120ffff, 8a580a01121... |
| 1 | 89580a0112bffff | [8a580a0112affff] |
| 2 | 89580a0112fffff | [8a580a0112e7fff] |
| 3 | 89580a0129bffff | [8a580a012987fff, 8a580a012997fff, 8a580a01299... |
| 4 | 89580a012d3ffff | [8a580a012d0ffff, 8a580a012d27fff, 8a580a012d2... |
layer_constrained = ghsl_gridded_zoom_rescaled.merge(constraint_gridded_zoom_rescaled,on="h3_id",how="left")
print(layer_constrained.shape)
layer_constrained.head(3)
(45325, 18)
| h3_native | gid_0 | country | gid_1 | agriculture_usd_2015 | band | x | y | gid_1_right | total_band | band_frac | color | h3_id | count | h3_id_band_gridded | x_h3 | y_h3 | child_cells | |
|---|---|---|---|---|---|---|---|---|---|---|---|---|---|---|---|---|---|---|
| 0 | 88580a0b3bfffff | NGA | Nigeria | NGA.20_1 | 2.325922e+09 | 17891.99997 | 8.625 | 12.210938 | NGA.20_1 | 3.903990e+06 | 0.004583 | [37, 133, 142, 255] | 89580a0b443ffff | 149 | 120.0 | 10.089947 | 12.989684 | NaN |
| 1 | 88580a0b3bfffff | NGA | Nigeria | NGA.20_1 | 2.325922e+09 | 17891.99997 | 8.625 | 12.210938 | NGA.20_1 | 3.903990e+06 | 0.004583 | [37, 133, 142, 255] | 89580a0b447ffff | 149 | 120.0 | 10.089947 | 12.989684 | NaN |
| 2 | 88580a0b3bfffff | NGA | Nigeria | NGA.20_1 | 2.325922e+09 | 17891.99997 | 8.625 | 12.210938 | NGA.20_1 | 3.903990e+06 | 0.004583 | [37, 133, 142, 255] | 89580a0b44bffff | 149 | 120.0 | 10.089947 | 12.989684 | NaN |
# We exclude the cells for which the constraint was identified, their 'child_cell' variable is not na
layer_constrained = layer_constrained[layer_constrained.child_cells.isna()]
# layer_constrained.reset_index(drop=False,inplace=True)
layer_constrained["color"] = cmap((layer_constrained.h3_id_band_gridded),palette=col_pal)
Max input : 292.00, palette colors : 10
#####
constrained_layer = pdk.Layer(
"H3HexagonLayer",
layer_constrained,
pickable=True,
stroked=True,
filled=True,
opacity=.5,
extruded=False,
get_hexagon= "h3_id",
get_fill_color = "color",
get_line_color= [0, 0, 0, 100],
line_width_min_pixels=0,
line_width_max_pixels=1,
)
constraint_layer = pdk.Layer(
"H3HexagonLayer",
constraint_gridded_zoom_rescaled,
pickable=True,
stroked=True,
filled=True,
opacity=.5,
extruded=False,
get_hexagon= "h3_id",
get_fill_color = [56, 65, 87, 255],
get_line_color= [0, 0, 0, 100],
line_width_min_pixels=0,
line_width_max_pixels=1,
)
# Create mapdeck object
deck_map_agri_layer_constrained = pdk.Deck(layers=[
constrained_layer,
constraint_layer]
,initial_view_state=view_state_zoomed
,tooltip= {"text": "Value : {h3_id_band_gridded}"}
,map_style="road"
)
deck_map_agri_layer_constrained.to_html("../../deck_maps/deck_ghsl_agri_constrained.html",
iframe_height=800,
# open_browser=True
)