#Base
import os
import numpy as np
import random as rd
# data eng
import h3
import shapely as shp
import geopandas as gpd
import pandas as pd
import rioxarray as rx
import osmnx as ox
import h3
# module
import scalenav.scale_nav as sd
import scalenav.data as dt
### Visualisation related
import pydeck as pdk
from matplotlib import pyplot as plt
import seaborn as sns
import pypalettes as pypal
Introduction to rescaling
This document elaborates on the techniques to downscale geospatial data sets across different resolutions.
nice blog post: https://strimas.com/post/hexagonal-grids/
point(-0.1275,51.5131)
poly(-0.12496,51.51047,-0.12029,51.51305)
def make_poly(x_min,y_min,x_max,y_max):
return shp.Polygon([(x_min,y_min),(x_max,y_min),(x_max,y_max,),(x_min,y_max)])
# x = 51.5119
# y = -0.1227
x_1 = -0.12496
x_2 = -0.12029
y_1 = 51.51047
y_2 = 51.51305
square = make_poly(x_1,y_1,x_2,y_2)
square

y,x = square.centroid.x,square.centroid.y
# res_s2 = 14
# s2_cell = s2.geo_to_s2(lat=y,lon=x,res=res_s2)
# s2_cell_coords = s2.s2_to_geo_boundary(s2_cell)
# s2_cell_geo = Polygon(s2_cell_coords)
print(x,y)
51.51176 -0.12262499999999998
res_h3 = 11
h3_cell = h3.latlng_to_cell(lng=y,lat=x,res=res_h3)
h3_geo = h3.cells_to_h3shape([h3_cell])
h3_geo
<H3Poly: [6]>
h3_d = np.round(np.sqrt(h3.cell_area(h3_cell,unit="m^2")),2)
h3_d
# np.sqrt(h3.cell_area(h=h3_cell,unit="m^2"))
43.84
# relative neighbors
i_range = range(-4,4)
j_range = range(-4,4)
coords = [(i,j) for i in i_range for j in j_range]
ref_cell = h3.cell_to_local_ij(origin=h3_cell,h=h3_cell)
# coords
neighbs = [h3.local_ij_to_cell(origin=h3_cell,i=ref_cell[0] + id[0],j=ref_cell[1] + id[1]) for id in coords]
neighbs[0:5]
['8b194ad3245efff',
'8b194ad324edfff',
'8b194ad324e8fff',
'8b194ad324eafff',
'8b194ad324c1fff']
ref_cell[0]
-5681
neighbs_geo = h3.cells_to_h3shape(neighbs)
# relative coordinates of the neighbors if approximating the shape with the h3 function
neighbs = [h3.cell_to_local_ij(origin=h3_cell,h=cell) for cell in h3.geo_to_cells(square,res=11)]
neighb_id= [(neighb[0]-ref_cell[0],neighb[1]-ref_cell[1]) for neighb in neighbs]
print(len(neighb_id))
neighb_id[0:5]
49
[(-2, -4), (3, 4), (-2, -2), (2, 1), (2, 3)]
Approximating other shapes with hexes
rast_to_h3 = {
"100": 12,
"1000" : 11,
"10000" : 9
}
res_h3 = 12
x = 51.51176
y = -0.1227
h3_cell = h3.latlng_to_cell(lng=y,lat=x,res=res_h3)
h3_geo = h3.cells_to_h3shape([h3_cell])
h3_geo
gpd.GeoSeries([h3_geo],crs="EPSG:4326").explore() # should show a hex over Covent garden in London
# Getting the ij neighbors h3 ids.
i_range = range(-4,5)
j_range = range(-4,5)
coords = [(i,j) for i in i_range for j in j_range]
# coords
ref_cell = h3.cell_to_local_ij(origin=h3_cell,h=h3_cell)
neighbs = [h3.local_ij_to_cell(origin=h3_cell,i=ref_cell[0]+id[0],j=ref_cell[1]+id[1]) for id in neighb_id]
neighbs
neighbs_geo = h3.cells_to_h3shape(neighbs)
# plots in the Atlantic Ocean
gpd.GeoSeries([h3_geo,neighbs_geo,square],crs="EPSG:4326").explore()
Make this Notebook Trusted to load map: File -> Trust Notebook
[x for x in coords if x in neighb_id]
[(-3, -4),
(-3, -3),
(-3, -2),
(-3, -1),
(-3, 0),
(-3, 1),
(-3, 2),
(-2, -4),
(-2, -3),
(-2, -2),
(-2, -1),
(-2, 0),
(-2, 1),
(-2, 2),
(-1, -3),
(-1, -2),
(-1, -1),
(-1, 0),
(-1, 1),
(-1, 2),
(-1, 3),
(0, -3),
(0, -2),
(0, -1),
(0, 0),
(0, 1),
(0, 2),
(0, 3),
(1, -3),
(1, -2),
(1, -1),
(1, 0),
(1, 1),
(1, 2),
(1, 3),
(2, -2),
(2, -1),
(2, 0),
(2, 1),
(2, 2),
(2, 3),
(2, 4),
(3, -2),
(3, -1),
(3, 0),
(3, 1),
(3, 2),
(3, 3),
(3, 4)]
Naive approach
def plot_df(df, column=None, ax=None):
'Plot based on the `geometry` column of a GeoPandas dataframe'
df = df.copy()
df = df.to_crs(epsg=3857) # web mercator
if ax is None:
fig, ax = plt.subplots(figsize=(8,8))
ax.get_xaxis().set_visible(False)
ax.get_yaxis().set_visible(False)
df.plot(
ax=ax,
alpha=0.5, edgecolor='k',
column=column, categorical=True,
legend=True, legend_kwds={'loc': 'upper left'},
)
cx.add_basemap(ax, crs=df.crs, source=cx.providers.CartoDB.Positron)
def plot_shape(shape, ax=None):
df = gpd.GeoDataFrame({'geometry': [shape]}, crs='EPSG:4326')
plot_df(df, ax=ax)
def plot_cells(cells, ax=None):
shape = h3.cells_to_h3shape(cells)
plot_shape(shape, ax=ax)
def plot_shape_and_cells(shape, res=9):
fig, axs = plt.subplots(1,2, figsize=(10,5), sharex=True, sharey=True)
plot_shape(shape, ax=axs[0])
plot_cells(h3.h3shape_to_cells(shape, res), ax=axs[1])
fig.tight_layout()
child_num = 7
res_ = 3
test_grid = [-15.161,0.725,10.371,18.208]
bbox_polygon = shp.geometry.box(*test_grid)
print(bbox_polygon.wkt)
POLYGON ((10.371 0.725, 10.371 18.208, -15.161 18.208, -15.161 0.725, 10.371 0.725))
h3_shape = h3.geo_to_h3shape(bbox_polygon)
h3_shape_cells = h3.h3shape_to_cells(h3_shape,res=res_)
h3_df = pd.DataFrame(pd.Series(h3_shape_cells),columns=["h3_id"],dtype='str')
# with polars
# h3_pl = pl.DataFrame(h3_df)
len(h3_shape_cells)
530
h3_df["geom"] = gpd.GeoSeries(h3_df.h3_id.apply(lambda x: h3.cells_to_h3shape([x])))
h3_df = gpd.GeoDataFrame(h3_df,geometry="geom")
Data manipulations
adding some randomly sampled data
alpha = 1
h3_df["values_e"] = [rd.expovariate(lambd=2*alpha) for x in h3_df.h3_id]
h3_df["values_i"] = [rd.expovariate(lambd=alpha) for x in h3_df.h3_id]
h3_df = sd.add_geom(h3_df)
h3_df.explore(column="values_e")
Make this Notebook Trusted to load map: File -> Trust Notebook
h3_df["child"] = h3_df.h3_id.apply(h3.cell_to_children)
h3_df_expl = h3_df[["child","values_i","values_e"]].explode("child").rename(columns={"child":"h3_id"})
h3_df_expl.head()
| h3_id | values_i | values_e | |
|---|---|---|---|
| 0 | 8454041ffffffff | 0.60214 | 0.180218 |
| 0 | 8454043ffffffff | 0.60214 | 0.180218 |
| 0 | 8454045ffffffff | 0.60214 | 0.180218 |
| 0 | 8454047ffffffff | 0.60214 | 0.180218 |
| 0 | 8454049ffffffff | 0.60214 | 0.180218 |
h3_df_expl["values_e"] = h3_df_expl[["h3_id","values_e"]].filter(regex="_e").mul({"values_e":1/child_num})
h3_df_expl = sd.add_geom(h3_df_expl)
h3_df_expl.explore(column = "values_e")
Make this Notebook Trusted to load map: File -> Trust Notebook
osm_admin = ox.geocode_to_gdf(query="Ile de France")
# osm_poly = h3.latlng_to_cell(osm_admin,res=res_)
osm_admin.explore()
Make this Notebook Trusted to load map: File -> Trust Notebook
osm_df = pd.DataFrame()
osm_cells = osm_admin.geometry.apply(lambda x: h3.geo_to_cells(x,res=6)).explode().reset_index(drop=True)
osm_cells
0 861fb6b4fffffff
1 861fb4607ffffff
2 861fb0ae7ffffff
3 861fb5497ffffff
4 861fb6a6fffffff
...
366 861fb6b07ffffff
367 861fb0197ffffff
368 861fb0a9fffffff
369 861fb6a27ffffff
370 861fb44dfffffff
Name: geometry, Length: 371, dtype: object
osm_df["compact"] = pd.Series(h3.compact_cells(osm_cells),index=None)
osm_df.head()
| compact | |
|---|---|
| 0 | 861fb0ae7ffffff |
| 1 | 861fb636fffffff |
| 2 | 861fb0307ffffff |
| 3 | 861fb448fffffff |
| 4 | 861fb0067ffffff |
osm_df["geom"] = osm_df.compact.apply(lambda x: h3.cells_to_h3shape([x]))
osm_df = gpd.GeoDataFrame(osm_df,geometry="geom",crs="EPSG:4326")
osm_df.explore()
Make this Notebook Trusted to load map: File -> Trust Notebook
### Projecting crops
mapspam_dir = "/Users/cenv1069/Documents/agriculture/mapspam/spam2017v2r1_ssa_val_prod/"
mapspan_files = os.listdir(mapspam_dir)
mapspam = rx.open_rasterio(mapspam_dir+mapspan_files[0],)
mapspam
<xarray.DataArray (band: 1, y: 2160, x: 4320)> Size: 37MB
[9331200 values with dtype=float32]
Coordinates:
* band (band) int64 8B 1
* x (x) float64 35kB -180.0 -179.9 -179.8 ... 179.8 179.9 180.0
* y (y) float64 17kB 89.96 89.88 89.79 ... -89.79 -89.87 -89.96
spatial_ref int64 8B 0
Attributes:
AREA_OR_POINT: Area
_FillValue: -1.0
scale_factor: 1.0
add_offset: 0.0mapspam_df_ = mapspam[0,:,:].to_pandas().melt(ignore_index=False).reset_index().rename(columns={"value":"value_var"})
mapspam_df_.head()
| y | x | value_var | |
|---|---|---|---|
| 0 | 89.958333 | -179.958334 | -1.0 |
| 1 | 89.875000 | -179.958334 | -1.0 |
| 2 | 89.791667 | -179.958334 | -1.0 |
| 3 | 89.708334 | -179.958334 | -1.0 |
| 4 | 89.625001 | -179.958334 | -1.0 |
mapspam_df_raw = mapspam_df_[mapspam_df_.value_var>0].reset_index(drop=True)
# mapspam_df = mapspam_df_[mapspam_df_.value_var>0].reset_index(drop=True)
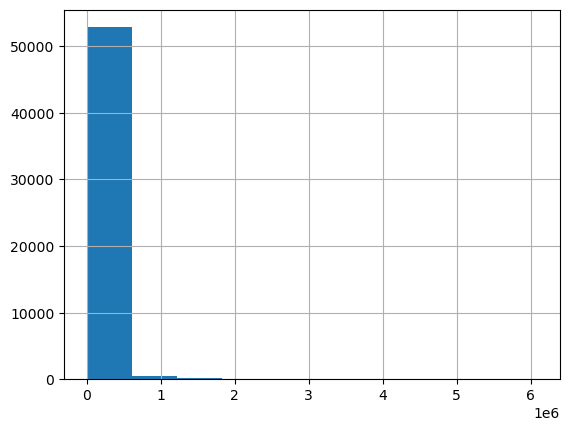
mapspam_df_raw.value_var.hist()
<Axes: >
res_crop = 6
# def get_square(h3_cell: str, d: float = 10000):
# h3_d = np.round(np.sqrt(h3.cell_area(h3_cell,unit="m^2")),2)
# frag = int(np.ceil(d/h3_d))
# h3_ref = h3.cell_to_local_ij(origin=h3_cell,h=h3_cell)
# i_range = range(-frag,frag+1)
# j_range = range(-frag,frag+1)
# coords = [(i,j) for i in i_range for j in j_range]
# # coords
# ref_cell = h3.cell_to_local_ij(origin=h3_cell,h=h3_cell)
# return [h3.local_ij_to_cell(origin=h3_cell,i=ref_cell[0]+id[0],j=ref_cell[1]+id[1]) for id in coords]
mapspam_df_raw.head()
| y | x | value_var | |
|---|---|---|---|
| 0 | 13.375306 | -16.792319 | 3647.500000 |
| 1 | 13.291973 | -16.792319 | 11340.200195 |
| 2 | 14.291969 | -16.708987 | 63.299999 |
| 3 | 14.208636 | -16.708987 | 189.699997 |
| 4 | 14.125303 | -16.708987 | 253.000000 |
# get_square("8854a93225fffff")
mapspam_df_raw["geom"] = mapspam_df_raw.filter(regex="h3_id_").apply(h3.cells_to_h3shape)
mapspam_gdf = gpd.GeoDataFrame(mapspam_df ,geometry=”geom” ,crs=”EPSG:4326”)
mapspam_gdf.iloc[0:100].explore(column=”value”) mapspam_gdf.head()
try : mapspam_df_raw.drop(labels=["h3_id"],axis={0},inplace=True)
except : Warning("Nothing to remove, skipping")
mapspam_df_raw["h3_id"] = mapspam_df_raw.apply(lambda row: h3.latlng_to_cell(row["y"],row["x"],res=res_crop),axis=1)
mapspam_df_raw.head()
| y | x | value_var | geom | h3_id | |
|---|---|---|---|---|---|
| 0 | 13.375306 | -16.792319 | 3647.500000 | NaN | 8654a9337ffffff |
| 1 | 13.291973 | -16.792319 | 11340.200195 | NaN | 8654a931fffffff |
| 2 | 14.291969 | -16.708987 | 63.299999 | NaN | 8654ad387ffffff |
| 3 | 14.208636 | -16.708987 | 189.699997 | NaN | 8654ad2a7ffffff |
| 4 | 14.125303 | -16.708987 | 253.000000 | NaN | 8654ad2afffffff |
mapspam_df = mapspam_df_raw[["h3_id","value_var"]].groupby("h3_id").agg("sum").reset_index()
mapspam_df.head()
| h3_id | value_var | |
|---|---|---|
| 0 | 865280477ffffff | 590.099976 |
| 1 | 865280807ffffff | 1376.800049 |
| 2 | 86528080fffffff | 524.500000 |
| 3 | 8652808c7ffffff | 1311.199951 |
| 4 | 8652808d7ffffff | 1901.199951 |
compact_geo = sd.add_geom(mapspam_df)
compact_geo.shape
(53680, 3)
compact_geo["log_value_var"] = np.round(np.log1p(compact_geo["value_var"]))
compact_geo.head()
| h3_id | value_var | geom | log_value_var | |
|---|---|---|---|---|
| 0 | 865280477ffffff | 590.099976 | POLYGON ((38.27947 12.86167, 38.29737 12.83463... | 6.0 |
| 1 | 865280807ffffff | 1376.800049 | POLYGON ((38.5914 13.4915, 38.57351 13.51876, ... | 7.0 |
| 2 | 86528080fffffff | 524.500000 | POLYGON ((38.5914 13.4915, 38.57484 13.46133, ... | 6.0 |
| 3 | 8652808c7ffffff | 1311.199951 | POLYGON ((38.57751 13.34657, 38.59536 13.31938... | 7.0 |
| 4 | 8652808d7ffffff | 1901.199951 | POLYGON ((38.57751 13.34657, 38.5431 13.34362,... | 8.0 |
compact_geo.loc[0:1000].explore(column="log_value_var")
Make this Notebook Trusted to load map: File -> Trust Notebook
compact_geo.head()
| h3_id | value_var | geom | log_value_var | |
|---|---|---|---|---|
| 0 | 865280477ffffff | 590.099976 | POLYGON ((38.27947 12.86167, 38.29737 12.83463... | 6.0 |
| 1 | 865280807ffffff | 1376.800049 | POLYGON ((38.5914 13.4915, 38.57351 13.51876, ... | 7.0 |
| 2 | 86528080fffffff | 524.500000 | POLYGON ((38.5914 13.4915, 38.57484 13.46133, ... | 6.0 |
| 3 | 8652808c7ffffff | 1311.199951 | POLYGON ((38.57751 13.34657, 38.59536 13.31938... | 7.0 |
| 4 | 8652808d7ffffff | 1901.199951 | POLYGON ((38.57751 13.34657, 38.5431 13.34362,... | 8.0 |
compact_geo_downscaled = sd.change_scale(grid=compact_geo, level=-3)
compact_geo_downscaled["log_value_var"] = np.round(np.log1p(compact_geo_downscaled["value_var"]),decimals=2)
compact_geo_downscaled.head()
Skipping geom
| h3_id | child_cells | value_var | log_value_var | |
|---|---|---|---|---|
| 0 | 835280fffffffff | [8452805ffffffff, 8452809ffffffff, 845280dffff... | 4.969470e+04 | 10.81 |
| 1 | 835282fffffffff | [8452821ffffffff, 8452823ffffffff, 8452825ffff... | 1.189984e+06 | 13.99 |
| 2 | 835283fffffffff | [8452831ffffffff, 8452835ffffffff, 8452837ffff... | 3.338324e+05 | 12.72 |
| 3 | 835284fffffffff | [8452841ffffffff, 8452843ffffffff, 8452845ffff... | 1.562956e+06 | 14.26 |
| 4 | 835285fffffffff | [8452853ffffffff, 845285dffffffff] | 1.291540e+04 | 9.47 |
max_geom = np.min([50_000,compact_geo_downscaled.shape[0]])
compact_geo_downscaled_sub = sd.add_geom(compact_geo_downscaled.loc[0:max_geom].copy())
compact_geo_downscaled_sub.reset_index(drop=True,inplace=True)
compact_geo_downscaled_sub.head()
| h3_id | child_cells | value_var | log_value_var | geom | |
|---|---|---|---|---|---|
| 0 | 835280fffffffff | [8452805ffffffff, 8452809ffffffff, 845280dffff... | 4.969470e+04 | 10.81 | POLYGON ((37.97019 12.83405, 38.46072 12.47793... |
| 1 | 835282fffffffff | [8452821ffffffff, 8452823ffffffff, 8452825ffff... | 1.189984e+06 | 13.99 | POLYGON ((37.27428 11.9689, 37.76603 11.61796,... |
| 2 | 835283fffffffff | [8452831ffffffff, 8452835ffffffff, 8452837ffff... | 3.338324e+05 | 12.72 | POLYGON ((38.35619 11.87175, 38.83967 11.52114... |
| 3 | 835284fffffffff | [8452841ffffffff, 8452843ffffffff, 8452845ffff... | 1.562956e+06 | 14.26 | POLYGON ((38.07384 13.44699, 38.67299 13.69993... |
| 4 | 835285fffffffff | [8452853ffffffff, 845285dffffffff] | 1.291540e+04 | 9.47 | POLYGON ((39.75747 13.58785, 39.8701 14.19935,... |
# compact_geo.to_file("outputs/compact_geo.geojson")
Color palette
viridis = sns.color_palette("viridis", as_cmap=True)
viridis
viridis

under
bad
over
bmlunge = pypal.load_cmap("Bmlunge")
bmlunge.N
6
def cmap(input, palette):
m = np.max(input.to_list())
l = palette.N
print("Max input : {}, palette colors : {}".format(m,l))
return [[int(255*j) for j in palette(int(x/m*l))] for x in input] #
unique_vals = pd.Series(compact_geo_downscaled["log_value_var"].unique())
unique_vals.head()
0 10.81
1 13.99
2 12.72
3 14.26
4 9.47
dtype: float32
cols = cmap(compact_geo_downscaled_sub["log_value_var"],palette=bmlunge) #pd.Series([[255*j for j in x] for x in bmlunge(compact_geo_downscaled["log_value"])])
compact_geo_downscaled_sub["color"] = cols
Max input : 18.690000534057617, palette colors : 6
compact_geo_downscaled_sub.head()
| h3_id | child_cells | value_var | log_value_var | geom | color | |
|---|---|---|---|---|---|---|
| 0 | 835280fffffffff | [8452805ffffffff, 8452809ffffffff, 845280dffff... | 4.969470e+04 | 10.81 | POLYGON ((37.97019 12.83405, 38.46072 12.47793... | [52, 170, 182, 255] |
| 1 | 835282fffffffff | [8452821ffffffff, 8452823ffffffff, 8452825ffff... | 1.189984e+06 | 13.99 | POLYGON ((37.27428 11.9689, 37.76603 11.61796,... | [61, 118, 136, 255] |
| 2 | 835283fffffffff | [8452831ffffffff, 8452835ffffffff, 8452837ffff... | 3.338324e+05 | 12.72 | POLYGON ((38.35619 11.87175, 38.83967 11.52114... | [61, 118, 136, 255] |
| 3 | 835284fffffffff | [8452841ffffffff, 8452843ffffffff, 8452845ffff... | 1.562956e+06 | 14.26 | POLYGON ((38.07384 13.44699, 38.67299 13.69993... | [61, 118, 136, 255] |
| 4 | 835285fffffffff | [8452853ffffffff, 845285dffffffff] | 1.291540e+04 | 9.47 | POLYGON ((39.75747 13.58785, 39.8701 14.19935,... | [52, 170, 182, 255] |
# viewport = pdk.data_utils.compute_view(points=compact_geo_downscaled[['x', 'y']], view_proportion=0.9)
viewport = pdk.ViewState(longitude=0,latitude=0,zoom=3)
# auto_zoom_map = pdk.Deck(layers=[], initial_view_state=viewport)
# auto_zoom_map.show()
# scaled_layer = pdk.Layer(
# "GeoJsonLayer",
# compact_geo_downscaled_sub,
# pickable=True,
# extruded=False,
# filled=True,
# stroked=True,
# opacity=.6,
# get_geometry = "geom",
# get_fill_color = "color", #"[255*log_value/20,100,120]",
# get_line_color= [255, 255, 255, 0],
# line_width_min_pixels=1,
# )
h3_layer = pdk.Layer(
"H3HexagonLayer",
compact_geo_downscaled_sub,
pickable=True,
stroked=True,
filled=True,
opacity=.5,
extruded=False,
get_hexagon="h3_id",
get_fill_color= "color",
get_line_color=[0, 0, 0, 0],
line_width_min_pixels=1,
)
# raster_centr_layer = pdk.Layer(
# "ScatterplotLayer",
# mapspam_df_raw,
# pickable=True,
# opacity=0.3,
# stroked=True,
# filled=True,
# radius_scale=1,
# radius_min_pixels=4,
# radius_max_pixels=5,
# line_width_min_pixels=1,
# get_position=["x","y"],
# get_radius=5,
# get_fill_color=[255, 140, 0],
# get_line_color=[0, 0, 0, 0],
# )
r = pdk.Deck(layers=[h3_layer]
,initial_view_state=viewport,tooltip=True)
# h3_layer
# Create an HTML header to display the year
# display_el = ipywidgets.HTML('<h1>Cropland in Sub-Saharan africa</h1>')
# display(display_el)
# Show the current visualization
# r.show()
r.to_html("../../deck_maps/cropland_downscaled.html",iframe_height=800)
Algorightm ameliorations
# mapspam_harv_area = glob.glob("mapspam/spam2017v2r1_ssa_harv_area/*")
# from re import search
# mapspam_harv_area_sel = [x for x in mapspam_harv_area if search(string=x,pattern="TEAS")]
# mapspam_harv_area_sel
# mapsmam_out_path = "mapspam_teas_ha.geojson"
teas_grid = mapspam_df_raw.copy()
# sn.rast_to_centroid(out_path=mapsmam_out_path,tiff_paths=mapspam_harv_area_sel[1:2]).reset_index(inplace=False,drop=True)
print(teas_grid.shape)
teas_grid.head(3)
(53680, 5)
| y | x | value_var | geom | h3_id | |
|---|---|---|---|---|---|
| 0 | 13.375306 | -16.792319 | 3647.500000 | NaN | 8654a9337ffffff |
| 1 | 13.291973 | -16.792319 | 11340.200195 | NaN | 8654a931fffffff |
| 2 | 14.291969 | -16.708987 | 63.299999 | NaN | 8654ad387ffffff |
teas_grid = gpd.GeoDataFrame(teas_grid, geometry=teas_grid.apply(lambda row: shp.Point(row["x"],row["y"]),axis=1),crs=4326)
teas_grid.head()
| y | x | value_var | geom | h3_id | geometry | |
|---|---|---|---|---|---|---|
| 0 | 13.375306 | -16.792319 | 3647.500000 | NaN | 8654a9337ffffff | POINT (-16.79232 13.37531) |
| 1 | 13.291973 | -16.792319 | 11340.200195 | NaN | 8654a931fffffff | POINT (-16.79232 13.29197) |
| 2 | 14.291969 | -16.708987 | 63.299999 | NaN | 8654ad387ffffff | POINT (-16.70899 14.29197) |
| 3 | 14.208636 | -16.708987 | 189.699997 | NaN | 8654ad2a7ffffff | POINT (-16.70899 14.20864) |
| 4 | 14.125303 | -16.708987 | 253.000000 | NaN | 8654ad2afffffff | POINT (-16.70899 14.1253) |
centroid = [teas_grid.geometry.loc[0:100].x.median(),teas_grid.geometry.loc[0:100].y.median()]
centroid = gpd.GeoSeries(shp.Point(centroid),crs=teas_grid.crs).to_crs("EPSG:4326")
lat_center = float(centroid.geometry.y.iloc[0])
lon_center = float(centroid.geometry.x.iloc[0])
view_state = pdk.ViewState(latitude=lat_center, longitude=lon_center, zoom=6, bearing=0, pitch=0)
teas_grid_4326 = teas_grid.to_crs("EPSG:4326")
teas_grid_4326[["x","y"]] = teas_grid_4326.get_coordinates()
teas_grid_4326.reset_index(inplace=True,drop=True)
layer_total = pdk.Layer(
"ScatterplotLayer",
teas_grid_4326.loc[0:1000],
pickable=True,
opacity=0.5,
stroked=True,
filled=True,
radius_scale=1,
radius_min_pixels=3,
radius_max_pixels=5,
line_width_max_pixels=0,
get_position= ["x","y"],
get_radius=2,
get_fill_color= [40, 2, 61],
get_line_color=[0, 0, 0]
)
# Create mapdeck object
deck_map = pdk.Deck(layers=[layer_total
]
,initial_view_state=view_state
,tooltip= {"text": "Value : {band}"}
,height=800
,map_style="road"
)
deck_map.to_html("../../deck_maps/deck_mapspam_teas_ha_grid.html")
h3_resolution = 8
teas_grid_4326 = dt.df_project_on_grid(teas_grid_4326,res=h3_resolution)
teas_grid_4326.head()
| y | x | value_var | geom | h3_id | geometry | |
|---|---|---|---|---|---|---|
| 0 | 13.375306 | -16.792319 | 3647.500000 | NaN | 8854a93225fffff | POINT (-16.79232 13.37531) |
| 1 | 13.291973 | -16.792319 | 11340.200195 | NaN | 8854a931d3fffff | POINT (-16.79232 13.29197) |
| 2 | 14.291969 | -16.708987 | 63.299999 | NaN | 8854ad3819fffff | POINT (-16.70899 14.29197) |
| 3 | 14.208636 | -16.708987 | 189.699997 | NaN | 8854ad2a51fffff | POINT (-16.70899 14.20864) |
| 4 | 14.125303 | -16.708987 | 253.000000 | NaN | 8854ad2ab7fffff | POINT (-16.70899 14.1253) |
from scalenav.data import rast_to_h3_map
rast_to_h3 = rast_to_h3_map(x=teas_grid_4326.x[0],y=teas_grid_4326.y[0],ref="m")
teas_grid_4326["h3_gridded"] = pd.Series(teas_grid_4326["h3_id"].apply(lambda cell: dt.centre_cell_to_square(h3_cell=cell,neighbs=rast_to_h3["10000"]["nn"])).tolist())
teas_grid_4326.head()
Using angles for meter grid.
Using angles for meter grid.
Using angles for meter grid.
Using angles for meter grid.
Using angles for meter grid.
| y | x | value_var | geom | h3_id | geometry | h3_gridded | |
|---|---|---|---|---|---|---|---|
| 0 | 13.375306 | -16.792319 | 3647.500000 | NaN | 8854a93225fffff | POINT (-16.79232 13.37531) | [8854a93201fffff, 8854a9320bfffff, 8854a93215f... |
| 1 | 13.291973 | -16.792319 | 11340.200195 | NaN | 8854a931d3fffff | POINT (-16.79232 13.29197) | [8854a9308dfffff, 8854a93089fffff, 8854a93083f... |
| 2 | 14.291969 | -16.708987 | 63.299999 | NaN | 8854ad3819fffff | POINT (-16.70899 14.29197) | [8854ad3a85fffff, 8854ad3a81fffff, 8854ad3ab9f... |
| 3 | 14.208636 | -16.708987 | 189.699997 | NaN | 8854ad2a51fffff | POINT (-16.70899 14.20864) | [8854ad216bfffff, 8854ad2147fffff, 8854ad2101f... |
| 4 | 14.125303 | -16.708987 | 253.000000 | NaN | 8854ad2ab7fffff | POINT (-16.70899 14.1253) | [8854ad2a93fffff, 8854ad2f4dfffff, 8854ad2f47f... |
teas_h3_gridded = teas_grid_4326.explode("h3_gridded")
# teas_h3_gridded["value_var"] = teas_h3_gridded["value_var"]/teas_h3_gridded["coeff"]
print(teas_h3_gridded.shape)
teas_h3_gridded.head(3)
(7461520, 7)
| y | x | value_var | geom | h3_id | geometry | h3_gridded | |
|---|---|---|---|---|---|---|---|
| 0 | 13.375306 | -16.792319 | 3647.5 | NaN | 8854a93225fffff | POINT (-16.79232 13.37531) | 8854a93201fffff |
| 0 | 13.375306 | -16.792319 | 3647.5 | NaN | 8854a93225fffff | POINT (-16.79232 13.37531) | 8854a9320bfffff |
| 0 | 13.375306 | -16.792319 | 3647.5 | NaN | 8854a93225fffff | POINT (-16.79232 13.37531) | 8854a93215fffff |
centroid = [teas_grid_4326.iloc[0:100].x.mean(),teas_grid_4326.iloc[0:100].y.mean()]
centroid = gpd.GeoSeries(shp.Point(centroid),crs=teas_grid_4326.crs).to_crs("EPSG:4326")
lat_center = float(centroid.geometry.y.iloc[0])
lon_center = float(centroid.geometry.x.iloc[0])
view_state = pdk.ViewState(latitude=lat_center, longitude=lon_center, zoom=6, bearing=0, pitch=0)
# subset_data = grid_4326[(grid_4326.band>0) and (grid_4326.band < max_val)]
layer_total = pdk.Layer(
"ScatterplotLayer",
teas_grid_4326.loc[0:100],
pickable=True,
opacity=1,
stroked=True,
filled=True,
radius_scale=5,
radius_min_pixels=3,
radius_max_pixels=5,
line_width_max_pixels=0,
get_position= ["x","y"],
get_radius=1,
get_fill_color= [200, 0, 150, 255],
get_line_color=[0, 0, 0]
)
h3_layer = pdk.Layer(
"H3HexagonLayer",
teas_h3_gridded.loc[0:100],
pickable=True,
stroked=True,
filled=True,
opacity=.1,
extruded=False,
get_hexagon="h3_gridded",
get_fill_color= [0,0,0,255],
get_line_color=[0, 0, 0, 0],
line_width_min_pixels=1,
)
# Create mapdeck object
deck_map = pdk.Deck(layers=[layer_total
,h3_layer]
,initial_view_state=view_state
,tooltip= {"text": "Value : {value_var}"}
,height=800
,map_style="road"
)
deck_map.to_html("../../deck_maps/deck_mapspam_teas_ha_grid.html")