Data preparation and infrastructure exposure to flooding
This notebook forms the basis of “Hands-On 5” in the CCG course.
Extract infrastructure data from OpenStreetMap
Extract flood hazard data from Aqueduct
Intersect floods with roads to calculate exposure
Open QGIS to look at the data
[1]:
# The os and subprocess modules are built into Python
# see https://docs.python.org/3/library/os.html
import os

# see https://docs.python.org/3/library/subprocess.html

# see https://docs.python.org/3/library/pathlib.html
from pathlib import Path
1. Prepare infrastructure data
1.1 Create a working folder
[2]:
dir = Path().resolve().parent.parent
new_folder = dir / "ghana_tutorial"
if not new_folder.exists():
    os.makedirs(new_folder)
[3]:
# edit this if using a Mac (otherwise delete)
data_folder = Path(new_folder)  # Path("YOUR_PATH/ghana_tutorial")

# edit this if using Windows (otherwise delete)
# data_folder = Path("C:YOUR_PATH/ghana_tutorial")

# delete this line
# data_folder = Path("../data")
1.2 Load Python libraries
[4]:
# Pandas and GeoPandas are libraries for working with datasets
# see https://geopandas.org/
import geopandas as gpd

gpd._compat.USE_PYGEOS = False
# see https://pandas.pydata.org/

# This package interacts with a risk data extract service, also accessible at
# https://global.infrastructureresilience.org/downloads
import irv_autopkg_client

# We'll use snail to intersect roads with flooding
import snail.intersection
import snail.io

# snkit helps generate connected networks from lines and nodes
# see https://snkit.readthedocs.io/
import snkit

# PyPROJ is a library for working with geographic projections
# see https://pyproj4.github.io/
from pyproj import Geod

from matplotlib import pyplot as plt

from urllib.request import urlretrieve
import zipfile
1.3 Download and save data
Download the ghana-latest-free.shp.zip dataset from http://download.geofabrik.de/africa/ghana.html, extract the zip folder and save the extracted folder within your new folder ghana_tutorial
[5]:
download_url = "https://download.geofabrik.de/africa/ghana-latest-free.shp.zip"
file_path = os.path.join(data_folder, "ghana-osm.zip")
# check if directory already exists
if not os.path.exists(Path(os.path.splitext(file_path)[0])):
    urlretrieve(download_url, file_path)  # note: this can take a few minutes
    with zipfile.ZipFile(file_path, "r") as zip_ref:
        zip_ref.extractall(os.path.splitext(file_path)[0])
else:
    print("data already exists")
data already exists
1.4 Load the road dataset
[6]:
roads = gpd.read_file(
    os.path.join(os.path.splitext(file_path)[0], "gis_osm_roads_free_1.shp")
)
[7]:
roads.head(5)
[7]:
| osm_id | code | fclass | name | ref | oneway | maxspeed | layer | bridge | tunnel | geometry | |
|---|---|---|---|---|---|---|---|---|---|---|---|
| 0 | 4790591 | 5121 | unclassified | Airport Road | None | B | 50 | 0 | F | F | LINESTRING (-0.17184 5.60847, -0.17182 5.60849... |
| 1 | 4790592 | 5122 | residential | Nortei Ababio Road | None | B | 50 | 0 | F | F | LINESTRING (-0.18282 5.61197, -0.18336 5.61198... |
| 2 | 4790594 | 5115 | tertiary | Airport Road | None | F | 50 | 0 | F | F | LINESTRING (-0.17544 5.6055, -0.17418 5.60555,... |
| 3 | 4790596 | 5121 | unclassified | Airport Road | None | F | 50 | 0 | F | F | LINESTRING (-0.17207 5.60853, -0.17207 5.60844... |
| 4 | 4790597 | 5122 | residential | Volta Road | None | B | 50 | 0 | F | F | LINESTRING (-0.18282 5.61197, -0.1828 5.61262,... |
[8]:
roads.fclass.unique()
[8]:
array(['unclassified', 'residential', 'tertiary', 'tertiary_link',
       'secondary', 'trunk', 'service', 'primary', 'motorway_link',
       'trunk_link', 'primary_link', 'secondary_link', 'footway', 'path',
       'track', 'motorway', 'track_grade3', 'track_grade4', 'steps',
       'pedestrian', 'bridleway', 'cycleway', 'track_grade2', 'busway',
       'track_grade5', 'track_grade1', 'living_street', 'unknown'],
      dtype=object)
1.5 Filter and clean the data
Filter out minor and residential roads, tracks and paths.
[9]:
# Keep only the specified columns
roads = roads[["osm_id", "fclass", "name", "geometry"]]
# Keep only the roads whose "fclass" is in the list
roads = roads[
    roads.fclass.isin(
        [
            "motorway",
            "motorway_link",
            "trunk",
            "trunk_link",
            "primary",
            "primary_link",
            "secondary",
            "secondary_link",
            "tertiary",
            "tertiary_link",
        ]
    )
]
# Rename some columns
roads = roads.rename(
    columns={
        "fclass": "road_type",
    }
)
Create topological network information - this adds information that will let us find routes over the road network.
add nodes at the start and end of each road segment
split roads at junctions, so each segment goes from junction to junction
add ids to each node and edge, and add
from_idandto_idto each edge
[10]:
road_network = snkit.Network(edges=roads)
[11]:
type(road_network)
[11]:
snkit.network.Network
[12]:
with_endpoints = snkit.network.add_endpoints(road_network)
split_edges = snkit.network.split_edges_at_nodes(with_endpoints)
with_ids = snkit.network.add_ids(
    split_edges, id_col="id", edge_prefix="roade", node_prefix="roadn"
)
connected = snkit.network.add_topology(with_ids)
roads = connected.edges
road_nodes = connected.nodes
Calculate the length of each road segment in meters
[13]:
geod = Geod(ellps="WGS84")
roads["length_m"] = roads.geometry.apply(geod.geometry_length)
[14]:
roads.tail(5)
[14]:
| osm_id | road_type | name | geometry | id | from_id | to_id | length_m | |
|---|---|---|---|---|---|---|---|---|
| 16244 | 1439354540 | primary | Graphic Road | LINESTRING (-0.21592 5.5546, -0.21562 5.55452,... | roade_16244 | roadn_8718 | roadn_5135 | 188.675096 |
| 16245 | 1439354541 | trunk | Dr. Busia Highway | LINESTRING (-0.23183 5.56271, -0.23141 5.56246... | roade_16245 | roadn_11348 | roadn_7945 | 154.835760 |
| 16246 | 1439354542 | trunk | Winneba Road | LINESTRING (-0.38247 5.54668, -0.38234 5.54674... | roade_16246 | roadn_5479 | roadn_11392 | 97.011372 |
| 16247 | 1439354543 | tertiary | None | LINESTRING (-0.45285 5.50639, -0.4531 5.50646,... | roade_16247 | roadn_5473 | roadn_12716 | 82.067327 |
| 16248 | 1441492227 | tertiary | Abeka Road | LINESTRING (-0.23592 5.59925, -0.23531 5.59905... | roade_16248 | roadn_7929 | roadn_7926 | 252.712114 |
[15]:
roads.set_crs(4326, inplace=True)
road_nodes.set_crs(4326, inplace=True)
road_nodes.crs
[15]:
<Geographic 2D CRS: EPSG:4326>
Name: WGS 84
Axis Info [ellipsoidal]:
- Lat[north]: Geodetic latitude (degree)
- Lon[east]: Geodetic longitude (degree)
Area of Use:
- name: World.
- bounds: (-180.0, -90.0, 180.0, 90.0)
Datum: World Geodetic System 1984 ensemble
- Ellipsoid: WGS 84
- Prime Meridian: Greenwich
[16]:
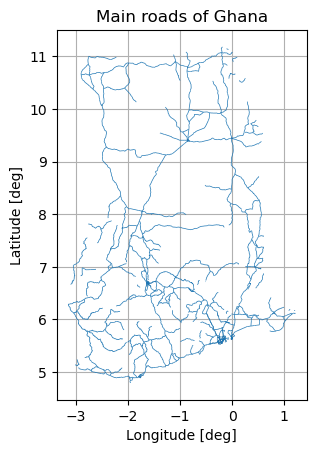
main_roads = roads[
    roads["road_type"].isin(
        [
            "trunk",
            "secondary",
        ]
    )
]

f, ax = plt.subplots()

main_roads.plot(
    ax=ax,
    alpha=1,
    linewidth=0.5,
)

ax.grid()
ax.set_title("Main roads of Ghana")
ax.set_xlabel("Longitude [deg]")
ax.set_ylabel("Latitude [deg]")
[16]:
Text(170.1578223077743, 0.5, 'Latitude [deg]')
1.6 Save the pre-processed dataset
[17]:
roads.to_file(
    data_folder / "GHA_OSM_roads.gpkg",
    layer="edges",
    driver="GPKG",
)
road_nodes.to_file(
    data_folder / "GHA_OSM_roads.gpkg",
    layer="nodes",
    driver="GPKG",
)
2. Prepare hazard data
The Aqueduct Global Flood Hazard Maps are available to download openly.
Country-level extracts are available through the GRI Risk Viewer. This section uses that service to download an extract for Ghana.
The full Aqueduct dataset is available to download. There are some scripts and summary of the data you may find useful at nismod/aqueduct.
There are almost 700 files in the full Aqueduct dataset, of up to around 100MB each, so we don’t recommend downloading all of them unless you intend to do further analysis. If you do, we recommend clipping to the study area of interest before proceeding.
[18]:
country_iso = "gha"
Create a client to connect to the data API:
[19]:
client = irv_autopkg_client.Client()
[20]:
# client.dataset_list()
[21]:
# client.dataset("wri_aqueduct.version_2")
[22]:
client.extract_download(
    country_iso,
    data_folder / "flood_layer",
    # there may be other datasets available, but only download the following
    dataset_filter=["wri_aqueduct.version_2"],
    overwrite=True,
)
3. Intersect hazard and infrastructure data
3.1 Specify your input and output path as well as the name of the intersection
Let us now intersect the hazard and the roads, starting with one hazard initially so we save time.
[23]:
flood_path = Path(
    data_folder,
    "flood_layer",
    "gha",
    "wri_aqueduct_version_2",
    f"wri_aqueduct-version_2-inunriver_historical_000000000WATCH_1980_rp00100-{country_iso}.tif",
)

output_path = Path(
    data_folder,
    "results",
    "inunriver_historical_000000000WATCH_1980_rp00100__roads_exposure.gpkg",
)
Read in pre-processed road edges, as created earlier.
[24]:
roads = gpd.read_file(data_folder / "GHA_OSM_roads.gpkg", layer="edges")
3.2 Run the intersection
[25]:
grid, bands = snail.io.read_raster_metadata(flood_path)

prepared = snail.intersection.prepare_linestrings(roads)
flood_intersections = snail.intersection.split_linestrings(prepared, grid)
flood_intersections = snail.intersection.apply_indices(flood_intersections, grid)
flood_data = snail.io.read_raster_band_data(flood_path)
flood_intersections["inunriver__epoch_historical__rcp_baseline__rp_100"] = (
    snail.intersection.get_raster_values_for_splits(flood_intersections, flood_data)
)
Calculate the exposed length
[26]:
geod = Geod(ellps="WGS84")
flood_intersections["flood_length_m"] = flood_intersections.geometry.apply(
    geod.geometry_length
)
[27]:
flood_intersections.tail(2)
[27]:
| osm_id | road_type | name | id | from_id | to_id | length_m | geometry | split | index_i | index_j | inunriver__epoch_historical__rcp_baseline__rp_100 | flood_length_m | |
|---|---|---|---|---|---|---|---|---|---|---|---|---|---|
| 16247 | 1439354543 | tertiary | None | roade_16247 | roadn_5473 | roadn_12716 | 82.067327 | LINESTRING (-0.45285 5.50639, -0.4531 5.50646,... | 0 | 337 | 679 | 0.0 | 82.067327 |
| 16248 | 1441492227 | tertiary | Abeka Road | roade_16248 | roadn_7929 | roadn_7926 | 252.712114 | LINESTRING (-0.23592 5.59925, -0.23531 5.59905... | 0 | 363 | 668 | 0.0 | 252.712114 |
Calculate the proportion of roads in our dataset which are exposed to >=1m flood depths in this scenario
[28]:
exposed_1m = flood_intersections[
    flood_intersections.inunriver__epoch_historical__rcp_baseline__rp_100 >= 1
]
exposed_length_km = exposed_1m.flood_length_m.sum() * 1e-3
exposed_length_km
[28]:
np.float64(748.0933306998515)
[29]:
all_roads_in_dataset_length_km = roads.length_m.sum() * 1e-3
all_roads_in_dataset_length_km
[29]:
np.float64(29279.892175665864)
[30]:
proportion = exposed_length_km / all_roads_in_dataset_length_km
proportion
[30]:
np.float64(0.02554972969885395)
[31]:
f"{proportion:.1%} of roads in this dataset are exposed to flood depths of >= 1m in a historical 1-in-100 year flood"
[31]:
'2.6% of roads in this dataset are exposed to flood depths of >= 1m in a historical 1-in-100 year flood'
[32]:
output_path.parent.mkdir(parents=True, exist_ok=True)
Save to file (with spatial data)
[33]:
flood_intersections.to_file(output_path, driver="GPKG")
Save to CSV (without spatial data)
[34]:
flood_intersections.drop(columns="geometry").to_csv(
    output_path.parent / output_path.name.replace(".gpkg", ".csv")
)